Workers’ Comp Marketing in Wisconsin
Where Wisconsin’s injured workers are, the state’s workers’-comp rules and benefit numbers, the legal competition you’re up against, and how to build predictable signed-case flow — grounded in BLS data and the Wisconsin workers’-comp agency.
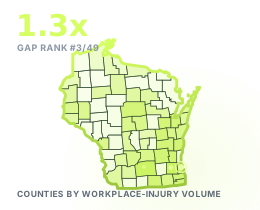
Wisconsin is one of the most underserved workers’-comp legal markets in the country. It runs about 18,316 estimated recordable workplace injuries a year against roughly 13,576 legal-services jobs — about 1.3 injuries for every legal-services worker, the #3 widest gap of 49 states. Injury demand is outpacing local legal capacity.
Estimated recordable injuries a year against the local supply of legal help. The wider the gap, the more injured-worker demand each firm can reach.
The demand isn’t evenly spread — a handful of counties drive most of the volume. Target these first.
Source: U.S. BLS Quarterly Census of Employment and Wages, 2023 Q1. Injury figures are modeled from BLS injury rates applied to covered employment; counties BLS suppresses for disclosure are omitted. Legal-services employment is BLS NAICS 5411 (all legal services, not workers’-comp attorneys alone).
The core numbers that shape an injured worker’s claim — the things your intake and ads have to speak to. Every figure is sourced to the state agency below.
What an injured worker actually faces under Wisconsin law — the framework your marketing and intake have to fit.
Employee has genuine free choice of physician (up to two), unlike neighboring panel/employer-directed states.
Governing agency: Wisconsin Department of Workforce Development, Worker's Compensation Division. Statutory details as of 2026 (source confidence: high). Benefit maximums, waiting periods and fee rules change — confirm current figures directly with the Wisconsin agency before relying on them. Max weekly TTD $1,375 effective April 1, 2026 (was $1,326 effective Jan 1, 2025).
How far a Wisconsin claim actually goes — the ceilings on permanent disability, death benefits, and how long wage-loss checks last. These are the numbers injured workers ask about first.
Sourced from the Wisconsin workers’-comp agency and statute, as of 2026 (source confidence: medium). Weekly maximums (TTD/PTD $1,375; PPD $454 eff 4/1/2026) verified from the state max-wage chart. Death-benefit structure (4x annual earnings; $10,000 burial) is per statute but not re-verified from a fetched official page. Mileage reimbursed at state rate, not confirmed (null). Maximums are indexed to the state average wage and change each year — confirm the current figure with the board before relying on it. See the source.
Employment in the sectors that drive the most workers’-comp claims — the industries your injured-worker audience actually works in.
Source: U.S. BLS Quarterly Census of Employment and Wages (sector employment, not injury counts). Construction, manufacturing, transportation & warehousing and health care are consistently among the highest workers’-comp claim sources.
The people behind the claims — the demographic signals that shape how you reach, intake, and sign injured workers in Wisconsin.
Sources: U.S. Census Bureau American Community Survey (language spoken at home, median household income, median age) and U.S. BLS Quarterly Census of Employment and Wages (covered employment). Statewide figures.
We work exclusively with workers’-comp firms and run the whole acquisition system, so injured-worker demand in Wisconsin actually turns into signed cases.
Google Ads
Injured-worker intent captured the moment they search — high-intent claim and injury keywords across Wisconsin.
Meta Ads
Facebook & Instagram lead generation where Wisconsin workers spend their time — creative built for injured-worker response.
SEO & Content
Compounding organic visibility across Wisconsin injury, claim, and workers’-comp searches — the asset that keeps paying.
Intake & Speed-to-Lead
The system that turns a lead into a signed case — fast response, tight follow-up, nothing slipping through.
- Wisconsin has about 18,316 estimated recordable injuries a year — real, ongoing demand for representation.
- It’s the #3 most underserved market of 49 states — injury demand outpaces legal capacity, so well-run marketing compounds fast.
- The demand is concentrated — a handful of counties above drive most of the volume, so targeting matters.
- We run the whole system — ads, SEO, and intake built specifically for injured-worker acquisition in Wisconsin.
See the national picture in our Workers’ Comp Coverage Gap study, compare every state on the by-state index, or drill into any county in the County Opportunity Explorer.
The Wisconsin tools injured workers are already finding
We publish and maintain these free calculators for Wisconsin. They are how injured workers in your market find us — and they are the same numbers your intake team is asked about every week. Free, no login.
Start with the Wisconsin workers’ compensation guide — deadlines, benefit rates and the state agency, in one place.
Build predictable case flow in Wisconsin
Book a call and we’ll map the Wisconsin opportunity for your firm — the channels, the numbers, and the plan.
Book a free call