Workers’ Comp Marketing
by State
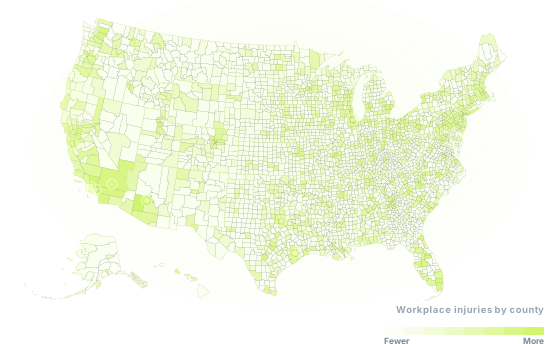
Every U.S. state ranked by workers’-comp legal opportunity — estimated recordable injuries against local legal supply, from BLS data. The higher the ratio, the more injury demand each unit of legal capacity has to absorb.
Injured workers and the lawyers who serve them cluster in different places. Higher bars = more injury demand per unit of legal capacity = a more underserved market. Linked states open a full local breakdown.
Hawaii is not in this ranking. BLS suppressed part of the industry detail behind its modeled injury count, so only a floor is publishable (at least 1,251 recordable injuries a year) and a floor cannot be ranked against values without understating it. The state still has its own report: Workers’ Comp Marketing in Hawaii.
Source: U.S. BLS Quarterly Census of Employment and Wages, 2023 Q1. Injuries are modeled from BLS injury rates; legal-services employment is BLS NAICS 5411. See the full methodology in the Coverage Gap study.
Find your market’s opportunity
Book a call and we’ll map the numbers for your state and firm.
Book a free call