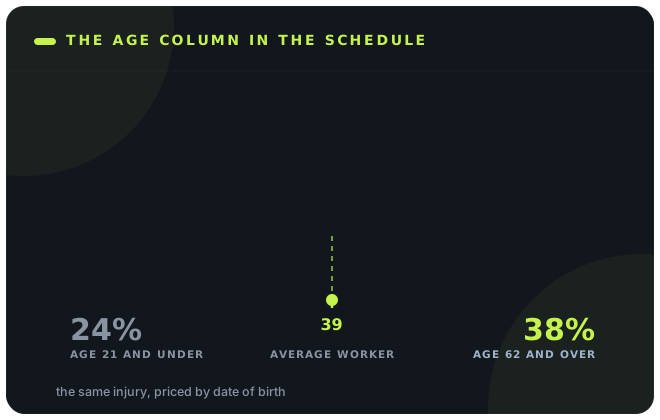
Open the audience settings on your firm’s best-performing ad set and look at the age field. Whatever is in there — 25 to 65+, 18 to 65+, 35 to 60 — somebody typed it once, probably in the account’s first month, probably to stop budget reaching people who do not work. Nobody has revisited it since, and nothing in the monthly report would prompt anyone to.
That field is the only place in a comp firm’s entire marketing stack where it buys a determinant of case value outright. Every other value driver arrives as a consequence: the industry mix follows from where the ads run, the injury mix follows from who answers them, the denial rate follows from the carriers in the market. Age is different. Age is a parameter. You set it, the platform honours some of it, and the comp act in your state has already decided what each bracket is worth.
The one case-value input you buy by typing it
Case value has a long list of inputs. Exactly one of them is available for purchase as an audience setting.
We have written at length about what a workers’ comp case is actually worth and why that number sets the ceiling on every acquisition cost a firm can defend. That piece works from the firm’s own closed files backwards. This one works forwards, from the one lever that sits upstream of the file.
Run the list of things that move a comp case’s value and ask, for each one, whether a firm can buy it. Body part: no — you take what walks in. Severity: no. Whether the claim is denied: no, that is the carrier’s decision. Whether there is a third-party defendant: no. Wage rate: only indirectly, through the industries your ads reach. Jurisdiction: yes, you buy that with geography, which is why the standing advice on Meta audiences is to spend your attention on geo and leave the rest broad.
And age. Age is on every self-serve ad platform as a first-class targeting parameter, available in a dropdown, and it is written into the compensation formula by statute. That coincidence is the subject of this article, and as far as we can tell nobody in legal marketing has looked at the two sides of it together.
The rating schedule has an age column
California prices age explicitly, in a table, and publishes it. Start there because it is the clearest instance of a mechanism that is not unique to California.
California’s permanent disability statute is unusually blunt about this. Labor Code § 4660.1(a), which governs injuries on or after 1 January 2013, provides that in determining the percentage of permanent disability “account shall be taken of the nature of the physical injury or disfigurement, the occupation of the injured employee, and the employee’s age at the time of injury.” Not his earnings. Not his life expectancy. His age, as a named statutory factor, sitting in the same sentence as the injury itself.
The schedule that implements it says why. The 2005 Schedule for Rating Permanent Disabilities explains that an impairment standard describes “a theoretical average worker… at the average age of 39,” and that after the earning-capacity and occupation adjustments, “finally, the rating is adjusted to account for the worker’s age on the date of injury.” Section 6 of the schedule is that adjustment, and it is a plain lookup table: find your occupation-adjusted rating in the left-hand column, read across to the column headed by the worker’s age, and the number at the intersection is the final permanent disability percentage.
Here is what the table does to a single rating. Take a worker whose injury, after the 1.4 modifier and the occupational adjustment, comes out at 30. Nothing about the injury changes across the row. Nothing about the job changes. Only the date of birth.
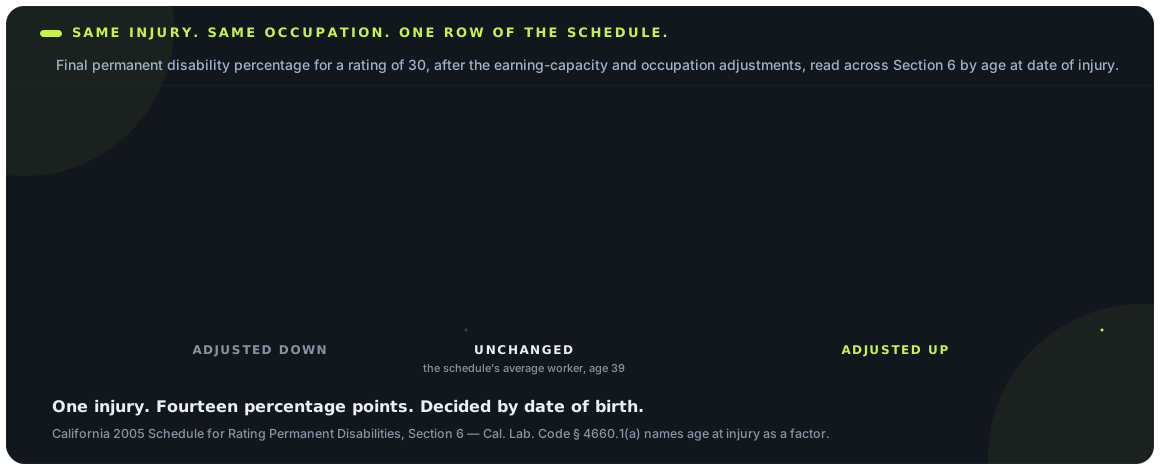
Fourteen percentage points of permanent disability, on one injury, decided by nothing but when the worker was born. A 21-year-old labourer and a 62-year-old labourer who hurt the same shoulder the same way in the same warehouse do not have the same case, and the difference is not clinical judgement or advocacy. It is a lookup.
Why 58% more rating is 96% more money
Permanent disability is not paid linearly. The bands get steeper as the rating rises, so the age adjustment compounds into the cheque.
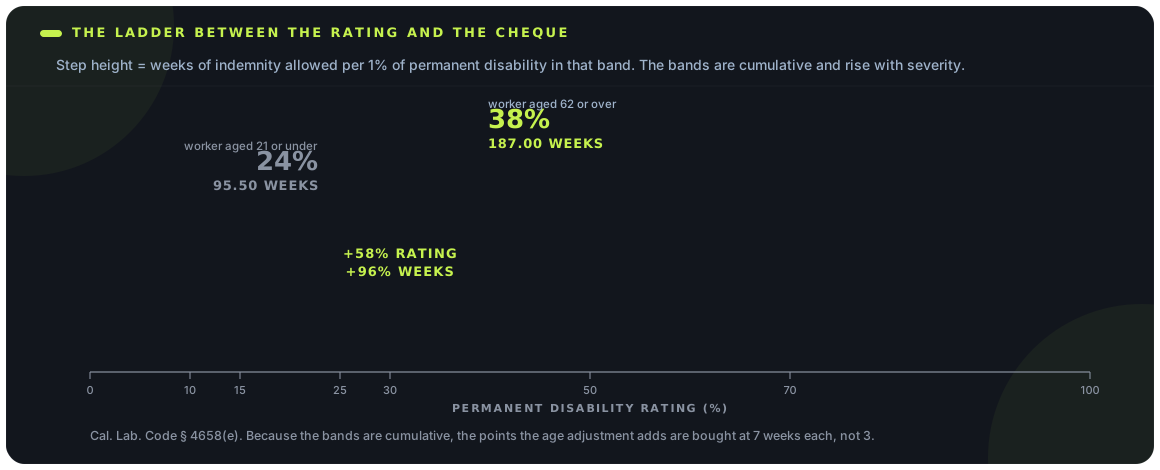
Thirty-eight is 58% more than twenty-four. The money is not 58% more, because California does not pay permanent disability at a flat rate per point. Labor Code § 4658(e) sets out a banded table of the number of weeks allowed for each 1% of permanent disability, and provides that those numbers “shall be cumulative, and shall increase with the severity of the disability.” The first band pays 3 weeks per point. By the 30–49.75% band it is 7 weeks per point.
So the age adjustment does not just add points — it pushes the rating into more expensive bands, and each point it adds there is worth more than the points below it.
Turning weeks into dollars needs one more statute. § 4453(b)(9) caps the average weekly earnings used to compute permanent partial disability for injuries on or after 1 January 2014 at $435, with a floor of $240 — and permanent disability is paid at two-thirds of that figure, so the maximum weekly permanent disability rate is $290 and the minimum is $160. Those rates have not moved since 2014, which is a separate scandal and not this article’s.
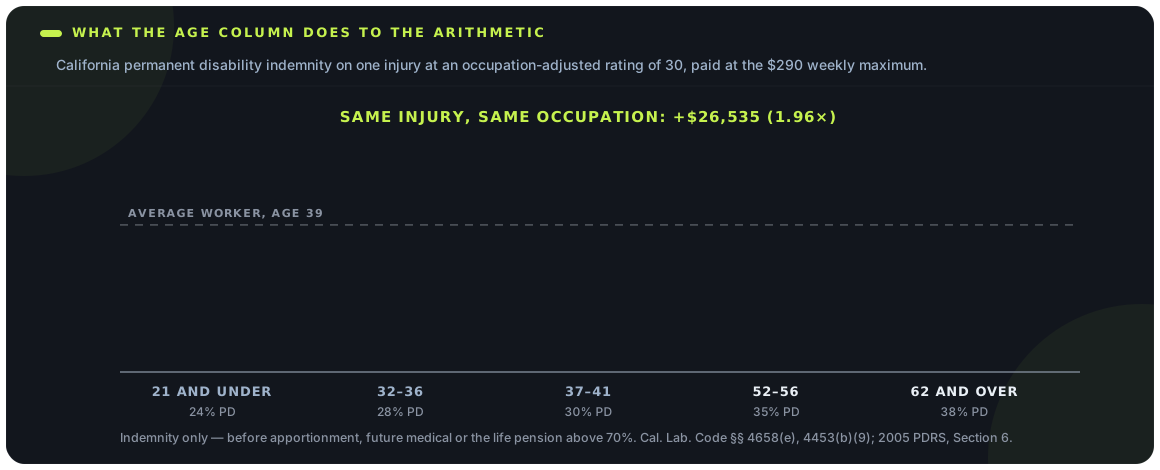
At the $290 maximum, the age column on one injury looks like this.
| Age at date of injury | Final PD rating | Weeks (§ 4658(e)) | PD indemnity at $290/wk | Fee at 15% |
|---|---|---|---|---|
| 21 and under | 24% | 95.50 | $27,695 | $4,154 |
| 22–26 | 25% | 100.75 | $29,218 | $4,383 |
| 27–31 | 27% | 112.75 | $32,698 | $4,905 |
| 32–36 | 28% | 118.75 | $34,438 | $5,166 |
| 37–41 | 30% | 131.00 | $37,990 | $5,699 |
| 42–46 | 32% | 145.00 | $42,050 | $6,308 |
| 47–51 | 33% | 152.00 | $44,080 | $6,612 |
| 52–56 | 35% | 166.00 | $48,140 | $7,221 |
| 57–61 | 37% | 180.00 | $52,200 | $7,830 |
| 62 and over | 38% | 187.00 | $54,230 | $8,135 |
Read the first and last rows together: $27,695 against $54,230 on the same injury, a difference of $26,535 in the client’s pocket and roughly $3,981 in the firm’s. The 15% column is illustrative — California attorney fees are fixed by the appeals board, customarily at 9%, 12% or 15% and requiring approval, which we covered in the piece on the fee promise that is really a fee statute. Use your own state’s figure. The shape does not change.
Three acts, three directions, one structure
California raises the number with age. Florida and Washington cut it. The thing all three share is not the direction — it is that age is in the formula at all.
It would be convenient to write “older workers are worth more, so buy older workers,” and it would be wrong. Two states we checked move in the opposite direction, and they do it at the top of the age range rather than the bottom.
Florida puts a hard stop on duration. Fla. Stat. § 440.15(1)(b) provides that entitlement to permanent total disability benefits “shall cease when the employee reaches age 75,” unless the employee is not eligible for social security benefits under 42 U.S.C. § 402 or § 423 “because the employee’s compensable injury has prevented the employee from working sufficient quarters.” The supplemental benefits in § 440.15(1)(f)1 stop earlier still: they “shall not be paid or payable after the employee attains age 62,” subject to the same exception. In a permanent total case, a Florida claimant injured at 60 has a materially shorter benefit stream than one injured at 40, and the statute says so by number.
Washington reduces the rate. RCW 51.32.225 provides that compensation for temporary or permanent total disability “shall be reduced by the department to allow an offset for social security retirement benefits.” Note carefully what the hook is: not an age, but the receipt of social security retirement benefits, which cannot begin before 62. The statute also exempts workers who had already applied for or were already receiving social security retirement benefits when they were injured. So Washington’s age effect is real but indirect, and it has an exclusion that California’s table does not.
That difference matters enough to say plainly, because the tempting single sentence over these three states — every one of them writes the worker’s age into the money — is not true as written. Washington’s statute never mentions an age. What is true of all three, and is the better claim anyway, is this: each act makes the value of an identical disability depend on where the worker sits in his working life, and the three acts do not agree on which end of that life is worth more.

The federal step your older clients pass through
Above a certain age, settlements acquire an extra party: CMS. That is not a value effect, it is a timing effect, and timing is a cash-flow problem.
There is a second, entirely separate way age attaches itself to a comp case, and it has nothing to do with the state act. It is Medicare.
CMS’s Workers’ Compensation Medicare Set-Aside Arrangement programme will review a proposed set-aside when either of two workload review thresholds is met: the claimant is a Medicare beneficiary and the total settlement exceeds $25,000, or the claimant “has a reasonable expectation of Medicare enrollment within 30 months of the settlement date” and the anticipated settlement for future medicals and lost wages exceeds $250,000. The current WCMSA Reference Guide, version 4.4 of 14 July 2025, then defines reasonable expectation with a list, and one item on it is a bare number: “The claimant is 62 years and 6 months old.”
Sixty-two and a half. Not a diagnosis, not a benefit status, an age. Past it, every settlement over $250,000 in your office is a candidate for a federal review step with its own submission, its own allocation report and its own waiting period. Below the Medicare-beneficiary threshold a $25,000 settlement does it too.
CMS is explicit that submission is recommended rather than statutorily required, and that the thresholds exist “based on CMS’ workload” rather than as permission to settle below them with impunity. None of which changes the operational fact for a firm: an older book of clients is a book with more federal touchpoints in it, and those touchpoints land between the agreement and the fee. If you have read our piece on the marketing budget as a loan to the docket, this is one more thing lengthening the loan — and unlike most of them, it is correlated with an audience setting.
Frequency runs the other way
The age brackets that produce the most injuries are not the brackets that produce the most valuable claims. That is the whole problem.
If value rose with age and volume rose with it too, there would be no decision to make. It does not. The BLS data runs in the opposite direction on frequency, and it is worth getting the shape right because it is counterintuitive.
For 2023–24, private industry recorded a days-away-from-work rate of 86.6 cases per 10,000 full-time workers, with a median of 8 days away (BLS SOII). Broken out by age, the National Safety Council’s reading of the same survey puts the 20–24 bracket highest on days-away rate at 111.1 and the 35–44 bracket lowest at 74.7. Young workers get hurt more often. That is not a surprise to anyone who has run a warehouse.
Severity inverts it. BLS’s census of fatal occupational injuries for 2024 puts the fatal work injury rate at 3.3 per 100,000 full-time equivalent workers across all ages — and at 9.1 for workers 65 and over, against 2.5 for the 20–24 and 25–34 brackets. An older worker is markedly less likely to be hurt and markedly more likely to be killed. The days-away picture points the same way: in the last SOII year published with medians by age, the median days away rose from 7 for 16–19-year-olds to 14 for every bracket from 45 upward, against a 12-day median overall.
| Age group | Rate | Against the all-worker rate of 3.3 |
|---|---|---|
| 16–17 | 2.7 | Below |
| 18–19 | 2.6 | Below |
| 20–24 | 2.5 | Lowest of any bracket |
| 25–34 | 2.5 | Lowest of any bracket |
| 35–44 | 2.8 | Below |
| 45–54 | 3.1 | Below |
| 55–64 | 4.1 | 1.24× |
| 65 and over | 9.1 | 2.76× |
Now put the two halves together, because the combination is the argument. The youngest working brackets deliver the most injury events per worker and the lowest statutory value per event. The oldest brackets deliver the fewest events, the longest absences, the highest fatality rate and — in California at least — close to double the indemnity on an identical impairment. And the auction prices impressions, not cases. Reach in the younger brackets is cheaper, the injury events behind it are more numerous, and a cost-per-lead report cannot tell the difference between a cheap lead and a cheap case.
Cost per lead is a per-event number. Age changes what the event is worth. A report built on the first will always recommend buying more of the second-cheapest thing in the room.
This is the same failure mode we described in the cost-per-signed-case model, arriving by a new route: not inverted by lead quality this time, but by the statutory value of the claimant’s birth year. And it is worth saying that the 65-plus bracket is not a rounding error. BLS put the labour force participation rate for Americans 65 and over at 19.1% in 2025 — down from a 20.2% peak in 2019, but well above the 12.9% of 2000. Nearly one in five.
The age control your account actually enforces
On Meta’s current audience model there is a hard control for the minimum age and none for the maximum. The end you can enforce is the end that costs you least to get wrong.
Here is where it turns operational, and where most firms will find they are not buying what they think they are buying.
Meta’s Advantage+ Audience separates what you enter into two kinds of input. Audience controls are hard constraints the system will not breach: location, minimum age, language, and exclusions. Audience suggestions — interests, custom audiences, lookalikes, and the age range itself — are starting points the system prioritises first and then goes beyond. The practical consequence, as Jon Loomer’s reading of the current behaviour sets out, is an asymmetry: there is a control for the age minimum and no control at all for the age maximum, so ads can and do deliver above whatever ceiling you typed. Under the original audience model, by contrast, both ends of the range bind.
Sit with the asymmetry for a second, because it is almost comically badly aimed for this practice area. The constraint the platform enforces is the floor — the end of the distribution where comp cases are cheapest to generate and worth least. The constraint it ignores is the ceiling — the end where the rating schedule nearly doubles the indemnity. A firm that set 25–55 years ago to “stop wasting money on retirees” has spent that whole time successfully excluding 18–24-year-olds and failing to exclude 60-year-olds, which is the opposite of the trade it thought it was making, and is probably the better outcome.
The honest conclusion is not that Meta has solved this for you. It is that the setting you have been treating as a precision instrument has been operating as a floor and a hint, and that the floor is the only part worth deliberating over. Which, as it happens, is roughly what the broad-targeting advice has said all along for different reasons: stop trying to hand-build the audience, spend the attention on geography and creative. That advice is right about delivery. What it has been silent on is the economics, and the economics have an age column.
What to do with this on Monday
Four moves, none of them requiring a new platform, a new report or a budget conversation.
One: break your own closed files down by the client’s age at injury. You already hold the date of birth and the date of injury on every file. Nobody has ever subtracted one from the other and sorted the fee column by the result. Do that first, before you believe a word of the California table, because your own docket is the only evidence that settles it for your firm. If your average fee in the 55-plus bracket is not meaningfully above your average fee under 30, the mechanism described here is being swamped by something else in your mix and you should go find out what.
Two: read your own act’s age provisions once. Three sections is usually enough: how the permanent disability percentage is determined, whether permanent total benefits terminate or taper, and whether there is a social security retirement offset. In California that is § 4660.1 and the schedule’s Section 6. In Florida it is § 440.15(1)(b) and (1)(f)1. In Washington it is RCW 51.32.225. Ask your own attorneys to point at the equivalents — this is a twenty-minute conversation that changes a media setting, and they will know the answer off the top of their heads.
Three: pull the age delivery breakdown and compare it with the field. Not to optimise it. To find out whether the number in the box has been doing anything at all for the last two years. Most firms will discover their ceiling is decorative.
Four: if you change anything, change the floor, and change it on evidence. The floor is the control that binds, and raising it is the only age move a platform will reliably honour. Whether it is the right move depends entirely on step one: in a state whose schedule adjusts upward with age, and with a docket that confirms it, lifting the minimum off 18 is defensible. In Florida, where two benefit streams stop at 62 and 75, the same reasoning runs out at the other end. We said in the piece on industry mix that comp advertising tends to be organised around the segment with the most deaths rather than the most claims; the age field is the same error in miniature, and it is a one-line fix rather than a strategy.
Where this stops
The limits are real and worth stating before somebody rebuilds a media plan on one table.
The California arithmetic is California’s. The age adjustment table, the banded weeks and the $290 ceiling are all specific to one act, and the two other states we checked move the other way at the top of the range. We have shown a mechanism, not a national constant, and we would be overstating it badly if we implied otherwise.
The arithmetic is also indemnity only. Permanent disability indemnity is one component of a comp case and often not the largest; future medical, the California life pension above 70%, apportionment under the prior-injury rules we covered in the apportionment piece, and the structure of the resolution itself all move the number more than the age column does. Apportionment in particular cuts against the argument, because a defence built on degenerative change has more to work with on an older claimant — and we have not tried to model the net of those two effects, because we cannot do it honestly from public data.
And the volume side is directional. The days-away rates by age come from the National Safety Council’s presentation of the BLS survey rather than from a BLS table we could read in full, and only two brackets are published there; the medians by age come from an earlier survey year than the rates do, which we have labelled but which makes them a weaker pairing than we would like. The fatality rates are BLS’s own and complete. Treat the frequency gradient as a well-supported direction and not as a number to plan against.
Finally: none of this is a reason to advertise differently to injured workers of different ages in the content of the advertising itself. The claim here is about what a case is worth and what a platform will enforce. How a firm speaks to a 24-year-old warehouse worker and a 61-year-old nurse is a creative and compliance question, and the compliance half of it has its own rules.
Key takeaways
-
Age is the only case-value input a firm buys by typing it. Body part, severity, denial and the presence of a third-party defendant all arrive as consequences. Jurisdiction and age are the two you set, and only age is written into the compensation formula.
-
California prices it in a published table. Cal. Lab. Code § 4660.1(a) names age at injury as a factor; Section 6 of the 2005 schedule turns an occupation-adjusted rating of 30 into 24% at 21 and under and 38% at 62 and over, with 37–41 as the neutral band because the standards describe a worker aged 39.
-
The money outruns the rating. § 4658(e)’s weeks-per-point bands are cumulative and rise with severity, so a 58% higher rating buys 96% more weeks: 95.50 against 187.00, or about $27,695 against $54,230 at the $290 maximum set by § 4453(b)(9).
-
The direction is not universal, so do not generalise it. Fla. Stat. § 440.15 stops permanent total benefits at 75 and supplemental payments at 62. RCW 51.32.225 offsets total disability against social security retirement benefits and names no age at all. What all three share is that the money depends on where the worker sits in his working life.
-
A federal review step attaches at 62½. CMS’s WCMSA Reference Guide v4.4 lists “the claimant is 62 years and 6 months old” as sufficient on its own for a reasonable expectation of Medicare enrolment within 30 months, which brings settlements over $250,000 into review; for an existing beneficiary the threshold is $25,000.
-
Frequency and value point in opposite directions. 20–24 has the highest days-away rate (111.1 per 10,000) and 35–44 the lowest (74.7), while the 2024 fatal injury rate runs 2.5 at 20–34 against 9.1 at 65-plus on an all-worker rate of 3.3. Cheap leads and valuable cases are in different brackets.
-
Your ad account enforces the floor and ignores the ceiling. Under Advantage+ Audience, minimum age is a hard control and there is no maximum-age control, so the age range is a suggestion delivery can exceed. The constraint that binds is at the cheap, low-value end of the distribution.
-
Start with your own files, not with this table. Subtract date of birth from date of injury on every closed file, bucket in fives, sort by fee. It is one column, it needs no new system, and it is the only evidence that decides the question for your firm.
-
Apportionment cuts the other way and we have not netted it. A degenerative-change defence has more to work with on an older claimant. The age column is a real effect in one direction; apportionment is a real effect in the other, and public data will not let anyone model the balance honestly.
WorkersComp Marketing is a marketing agency, not a law firm, and nothing here is legal advice about any claim, any client or any firm’s case-selection policy. How a permanent disability percentage is determined, whether and when benefits terminate by age, how a social security retirement offset applies, and what Medicare’s interests require in a particular settlement are all questions of state and federal law that turn on facts we do not have. The rating figures in this article are an illustration of one state’s published table at one statutory rate, not a valuation of any case. Statutes and schedules are amended and CMS revises its thresholds: the provisions cited here were read on 4 November 2026. Verify the current rule with counsel before it informs anything more consequential than an audience setting.
Frequently asked questions
Does a workers’ comp case really pay more just because the worker is older?
In California, holding the injury and the occupation constant, yes — and the state publishes the table that does it. Lab. Code § 4660.1(a) names “the employee’s age at the time of injury” as a factor in the permanent disability percentage, and Section 6 of the 2005 Schedule for Rating Permanent Disabilities turns an occupation-adjusted rating of 30 into 24% for a worker of 21 or under and 38% for a worker of 62 or over. The reasoning is lost earning capacity: the schedule’s impairment standards describe a worker at the average age of 39, and the same permanent impairment costs a worker nearer the end of his working life a larger share of what is left. Other states do not all work this way.
How much money is the age adjustment actually worth?
On that one example, about $26,535. A 24% rating is 95.50 weeks under the cumulative bands of § 4658(e); 38% is 187.00 weeks. At the $290 weekly maximum that § 4453(b)(9) produces for injuries on or after 1 January 2014, that is roughly $27,695 against $54,230 — just under double, on indemnity alone, before future medical, apportionment or the life pension that applies above 70%. The gap is wider than the rating gap because the weeks-per-point bands rise with severity, so the points the age adjustment adds are bought at 7 weeks each rather than 3.
So should we raise the minimum age in our ad accounts?
Only on your own evidence, and only after you know what your own act does. The sequence is: break your closed files down by age at date of injury and sort by fee; read your state’s provisions on how the permanent disability percentage is set, whether permanent total benefits terminate by age, and whether there is a social security retirement offset; then decide. In California the argument for lifting the floor off 18 is reasonable. In Florida, where § 440.15 ends permanent total entitlement at 75 and supplemental payments at 62, the same reasoning does not transfer. Applying a California rule to a Florida docket is the main way to get this wrong.
Can we just exclude older workers if our state taxes age the other way?
On Meta’s current audience model, not reliably. Advantage+ Audience distinguishes audience controls, which the system will not breach, from audience suggestions, which it treats as a starting point. Minimum age is a control. There is no maximum-age control, so the top of the range you type is a suggestion and delivery can go above it. The original audience model binds both ends. Check which one your ad sets use, then pull a delivery breakdown by age and compare it with the field — the breakdown is the fact, the field is only the intention.
Why does CMS matter to a marketing decision?
Because it attaches a federal review step to settlements by age, and that step lands between the agreement and the firm’s fee. CMS will review a proposed Medicare set-aside where the claimant is already a Medicare beneficiary and the settlement exceeds $25,000, or where there is a reasonable expectation of Medicare enrolment within 30 months and the anticipated settlement exceeds $250,000. Version 4.4 of the WCMSA Reference Guide lists being “62 years and 6 months old” as sufficient on its own for that reasonable expectation. An older book carries more of these, which lengthens the cash cycle rather than reducing the case value.
Don’t younger workers get hurt more often? Doesn’t that cancel it out?
They do get hurt more often, and whether it cancels out is exactly the question a firm should answer from its own files. BLS’s 2023–24 survey, as presented by the National Safety Council, puts the 20–24 bracket highest on days-away rate at 111.1 per 10,000 workers and 35–44 lowest at 74.7. Severity inverts: the 2024 fatal injury rate is 2.5 per 100,000 FTE for 20–34 and 9.1 for 65-plus, against 3.3 for all workers. More events at the young end, more consequential events at the old end. A cost-per-lead report sees only the events.
What about apportionment? Isn’t that worse for older claimants?
Yes, and it is the strongest objection to this article. A defence built on pre-existing degenerative change has more raw material on a 58-year-old spine than a 26-year-old one, and apportionment reduces the compensable share of exactly the ratings the age column has just raised. We have not attempted to net the two effects, because doing it honestly would need claim-level outcome data that is not public. The age adjustment is a documented statutory effect in one direction; treat apportionment as a documented effect in the other, and treat your own closed files as the tiebreak.
Is the 65-plus audience big enough to bother with?
Larger than most media plans assume. BLS reported a labour force participation rate of 19.1% for Americans 65 and over in 2025 — down from a 20.2% peak in 2019, but far above the 12.9% of 2000. Nearly one in five people past traditional retirement age is working or looking for work, and they are the bracket with the highest fatality rate and the highest falls rate on the job. Whether they are worth buying in your state is the open question; whether they exist in commercial quantity is not.
What is the smallest version of this we can actually do?
One column. Add age at date of injury, bucketed in fives, to whatever signed-case report your firm already produces, and sort the fee column by it. No new platform, no new tracking, no vendor conversation. Ninety days of that will tell you whether your acquisition skews young, whether your own fees follow age the way California’s schedule says they should, and whether your ad account’s age field has any relationship to either. Everything else in this article is a reason to look; that is the looking.
Sources & further reading
-
01
California — age as a statutory factor in the permanent disability percentage
Cal. Lab. Code § 4660.1(a), governing injuries on or after 1 January 2013: in determining the percentages of permanent partial or permanent total disability, “account shall be taken of the nature of the physical injury or disfigurement, the occupation of the injured employee, and the employee’s age at the time of injury.” Subdivision (b) applies the 1.4 adjustment factor to the whole person impairment rating. The predecessor section, § 4660, carries the same three factors for injuries before 2013.
-
02
California — the age adjustment table itself
DWC, 2005 Schedule for Rating Permanent Disabilities. Section 1, Part II.B.7: “Finally, the rating is adjusted to account for the worker’s age on the date of injury.” Section 6 is the table: locate the rating already adjusted for earning capacity and occupation, read across to the column headed by the age at time of injury. On the row for a rating of 30 the values are 24 (21 and under), 25 (22–26), 27 (27–31), 28 (32–36), 30 (37–41), 32 (42–46), 33 (47–51), 35 (52–56), 37 (57–61) and 38 (62 and over). The schedule states that its impairment standards describe “a theoretical average worker… at the average age of 39.” Read 4 November 2026.
-
03
California — weeks per point, and the weekly rate
Cal. Lab. Code § 4658(e) (injuries on or after 1 January 2013) sets the number of weeks for which two-thirds of average weekly earnings is allowed for each 1% of permanent disability, by band: 3 weeks (0.25–9.75%), 4 (10–14.75%), 5 (15–24.75%), 6 (25–29.75%), 7 (30–49.75%), 8 (50–69.75%) and 16 (70–99.75%), and provides that these “shall be cumulative, and shall increase with the severity of the disability.” § 4453(b)(9) caps average weekly earnings for permanent partial disability on injuries from 1 January 2014 at “not less than two hundred forty dollars ($240) nor more than four hundred thirty-five dollars ($435),” giving a $160–$290 weekly range. The week totals used here (95.50 at 24%, 131.00 at 30%, 187.00 at 38%) follow from applying the bands cumulatively.
-
04
Florida — benefits that stop at a stated age
Fla. Stat. § 440.15(1)(b): entitlement to permanent total disability benefits “shall cease when the employee reaches age 75,” unless the employee “is not eligible for social security benefits under 42 U.S.C. s. 402 or s. 423 because the employee’s compensable injury has prevented the employee from working sufficient quarters.” § 440.15(1)(f)1: supplemental payments “shall not be paid or payable after the employee attains age 62,” subject to the same exception.
-
05
Washington — the social security retirement offset, which names no age
RCW 51.32.225: compensation for temporary or permanent total disability “shall be reduced by the department to allow an offset for social security retirement benefits.” The section states no age; it keys on the receipt of social security retirement benefits, which cannot begin before 62. It does not apply to permanent total disability benefits received before 1 July 1986, nor to workers who had applied for or were already receiving social security retirement benefits at the time of injury. Where retirement benefits immediately follow social security disability benefits, the offset follows the formulas in 42 U.S.C. § 424a.
-
06
CMS — the set-aside review thresholds and the 62½ criterion
CMS will review a proposed WCMSA where “the claimant is a Medicare beneficiary and the total settlement amount is greater than $25,000.00” or “the claimant has a reasonable expectation of Medicare enrollment within 30 months of the settlement date and the anticipated total settlement amount for future medical expenses and disability or lost wages over the life or duration of the settlement agreement is expected to be greater than $250,000.00.” The reasonable-expectation list in the WCMSA Reference Guide, version 4.4 (14 July 2025), includes “The claimant is 62 years and 6 months old.” CMS notes the thresholds are set “based on CMS’ workload,” are subject to change, and are “not intended to indicate that claimants may settle below the threshold with impunity.”
-
07
BLS — fatal work injury rate by age, 2024
Census of Fatal Occupational Injuries, rate of fatal work injuries per 100,000 full-time equivalent workers by age group, 2024: all workers 3.3; 16–17 2.7; 18–19 2.6; 20–24 2.5; 25–34 2.5; 35–44 2.8; 45–54 3.1; 55–64 4.1; 65 and over 9.1.
-
08
BLS — days away from work, overall and by age
BLS SOII for 2023–24: private industry days-away-from-work incidence rate of 86.6 cases per 10,000 full-time workers, with a median of 8 days away. The National Safety Council’s presentation of the same survey reports the 20–24 bracket highest on overall days-away rate at 111.1 per 10,000 and the 35–44 bracket lowest at 74.7, with 65-plus highest on falls, slips and trips at 45.7; rates for the remaining brackets are not published there. The 2023–24 data use a new event and body-part classification, a break in series. Medians by age are from BLS Table R71 for 2020, private industry: 7 days at 16–19, 10 at 20–34, 12 at 35–44 and 14 at 45–54, 55–64 and 65-plus alike, against a 12-day overall median — an earlier year than the rates above, and labelled as such.
-
09
BLS — how many older Americans are still working
“In 2025, 19.1 percent of people age 65 and older participated in the labor force by working or looking for work” — down from a recent peak of 20.2 percent in 2019 and up from 12.9 percent in 2000. Men 65 and over 23.1 percent; women 15.7 percent. The 2025 annual estimates are 11-month averages excluding October, when collection was interrupted.
-
10
Meta — which age settings are controls and which are suggestions
Under Advantage+ Audience, location, minimum age, language and exclusions function as audience controls the system will not breach, while interests, custom audiences, lookalikes and the age range are treated as suggestions the system prioritises before going broader. There is no audience control for maximum age, so delivery can exceed the top of the range entered. Under the original audience model both ends of the age range bind. Platform behaviour changes; verify against a delivery breakdown by age in your own account.
-
11
Our own work this piece builds on
The value side of the equation and how to derive it from closed files; the cost-per-signed-case model and why cost per lead inverts; the cash-cycle argument for treating marketing spend as a loan to the docket; the fee statute behind the 15% column; and the apportionment defence that cuts against the age adjustment. The Workers’ Compensation Intelligence Center holds the BLS and Census series behind the frequency numbers, and the Growth Library holds the longer playbooks.