Open your marketing dashboard and count the numbers on it. Twenty? Thirty? Impressions, reach, click-through rate, cost per click, cost per lead, frequency, engagement — a wall of green and red arrows that changes every time you refresh.
Almost none of it tells you whether your marketing made money. That’s the trap. Complexity feels like insight, so agencies bury owners in metrics that move without meaning.
The firms that scale ignore the wall of numbers and watch three. This is that scoreboard — and why the rest is noise.
The vanity-metric trap
Why clicks, impressions, and cost per lead quietly mislead firm owners.
A vanity metric is any number that looks like progress but doesn’t connect to revenue. It goes up, you feel good, and nothing in your bank account changes.
Impressions are the purest example. A campaign can rack up half a million impressions and sign zero cases. The number is real; the meaning is not.
Cost per lead is the sneakiest one, because it looks like a business metric. It isn’t. A cheap lead that never signs is the most expensive lead you can buy.
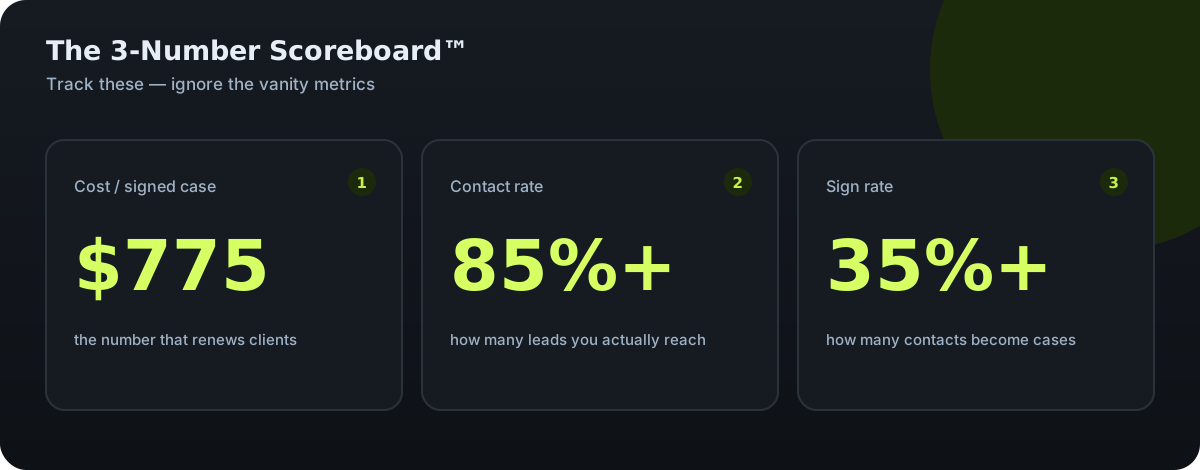
Here’s the pattern behind every vanity metric: it measures the top of your funnel and stays silent about the bottom. Below is what each one hides — and the metric to watch instead.
| Vanity metric | What it hides | Metric to track instead |
|---|---|---|
| Impressions | Whether anyone acted, or just scrolled past | Cost per signed case |
| Clicks / CTR | Whether clicks became leads, or bounced | Lead rate → sign rate |
| Cost per lead | Lead quality and whether leads ever sign | Cost per signed case |
| Cost per click | How many clicks it takes to make one case | Cost per signed case |
| Leads generated | How many were reached and converted | Contact rate + sign rate |
Benchmark figures: WordStream 2026 legal search averages. The “track instead” column reflects the framework used inside our client firms.
The only 3 metrics that matter
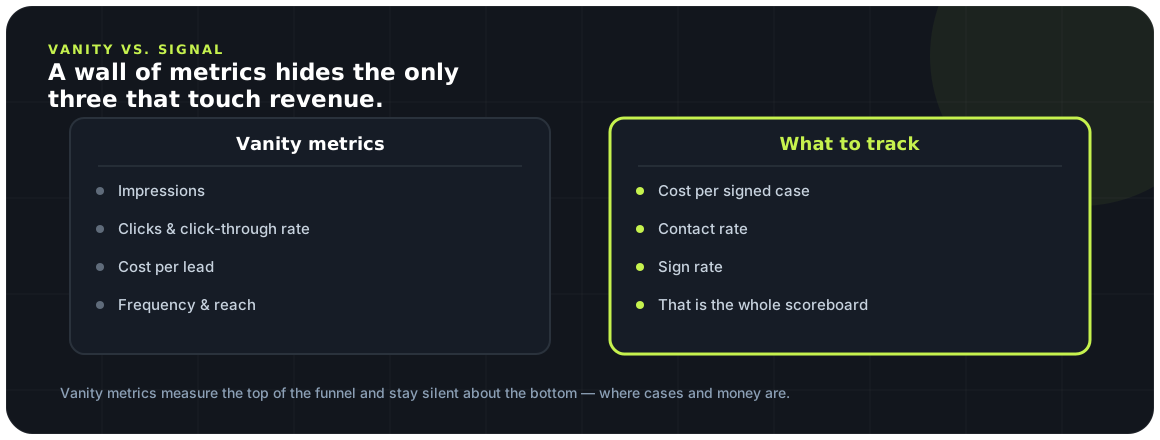
The 3-Number Scoreboard — the whole health of your marketing in three lines.
Every one of these ties directly to money or to a step that produces money. Together they answer the only question that matters: is this making us more than it costs?
1. Cost per signed case
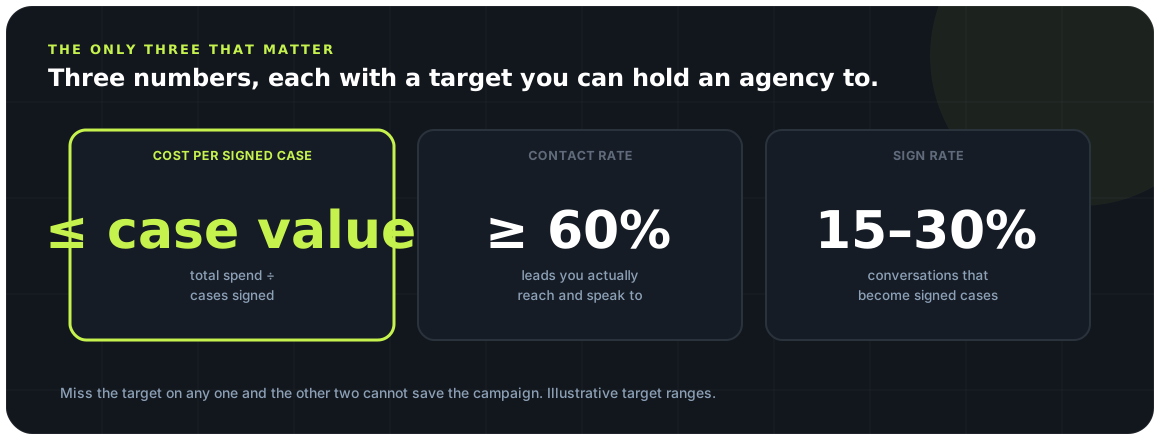
This is the whole ballgame. Cost per signed case is your total marketing spend divided by the number of cases you actually signed from it — not leads, not calls, signed retainers.
Why it’s number one: it’s the only metric that speaks the same language as your P&L. If a signed WC case is worth several thousand dollars to your firm, this number tells you instantly whether marketing is an investment or a leak.
Target range: most well-run WC campaigns land in the four-figure range per signed case. In the founder data behind this framework, blended spend produced signed cases at roughly $775 each — the benchmark to beat, not to expect on day one.
2. Contact rate
Contact rate is the share of your leads that your team actually reaches and speaks with. Lead comes in, you connect with a human — that’s a contact.
Why it matters: a lead you never reach can never sign. This is the single most fixable leak in most firms, and it’s driven almost entirely by speed. MIT’s Lead Response Management research found that responding in five minutes rather than thirty makes you up to 100× more likely to contact a lead and 21× more likely to qualify it.
Target range: poor firms sit below 40%. Good firms reach 60–75%. Elite firms, with sub-five-minute response, clear 85%.
3. Sign rate
Sign rate is the share of contacted leads that become signed cases. Once you’re talking to a qualified injured worker, how often do you win the retainer?
Why it matters: this measures your intake and your offer, not your ads. Two firms can spend identically and get wildly different results here — it’s where scripts, follow-up cadence, and trust do their work.
Target range: under 10% is poor. A healthy contact-to-signed rate runs 20–30%, and elite intake teams push past 35%.
How the three connect
The Signed-Case Equation — why these metrics multiply instead of add.
The scoreboard isn’t three separate numbers. It’s one chain, and every link multiplies the next:
Cases = Traffic × Lead Rate × Contact Rate × Sign Rate
The Signed-Case Equation — WorkersComp MarketingBecause these multiply, the leverage is enormous. Doubling your contact rate has the exact same effect on signed cases as doubling your ad budget — but it costs nothing.
That’s the reframe. Cost per signed case is the outcome; contact rate and sign rate are the two levers that move it fastest. Legal converts clicks to leads at about 10.53%, versus 7.52% across all industries — a decent head start, but only if you reach and sign what you generate.
Fix contact rate before you buy more traffic. It’s the cheapest way to double your budget without spending another dollar.
Spencer Moeller, WorkersComp Marketing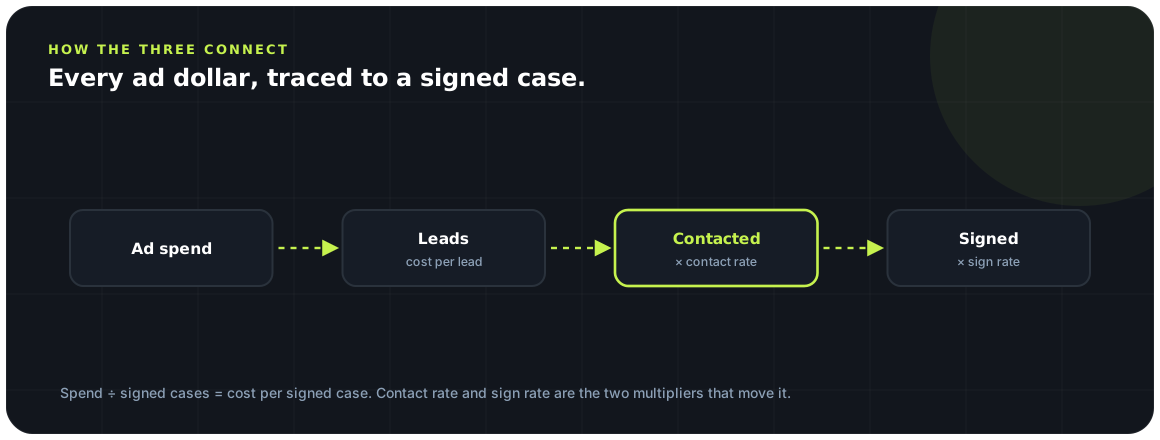
How to actually track them
Three tools, one dashboard — the minimum stack to see the truth.
You can’t manage what you can’t attribute. The good news: tracking all three metrics takes a small, standard stack, not a data team.
You need three things working together. Call tracking to know which campaign produced each call. A CRM to follow every lead from contact to signed case. And one dashboard that divides spend by signed cases per source.
The most common failure isn’t the tools — it’s the last step. Firms buy call tracking and a CRM, then never connect the signed-case outcome back to the source. Close that loop and the three metrics report themselves.
This is also what separates real reporting from agency theater. Ask your provider for cost-per-case reporting by channel; if they can’t produce it, they aren’t tracking what matters.
What good looks like
Poor, good, and elite — so you know where you actually stand.
Numbers only mean something against a benchmark. Here’s the range across the three metrics, plus the speed and quality inputs that drive them.
| Metric | Poor | Good | Elite |
|---|---|---|---|
| Cost per signed case | $3,000+ | $1,000–$2,000 | < $1,000 |
| Contact rate | < 40% | 60–75% | > 85% |
| Sign rate | < 10% | 20–30% | > 35% |
| Speed-to-lead (input) | > 1 hour | < 15 min | < 5 min |
| Lead type (input) | Shared | Mixed | Exclusive |
Ranges reflect industry consensus and our own campaign data; your numbers depend on market, offer, and intake. Directional model, not a quote.
Two inputs decide most of your tier. Speed, because a 2025 Hennessey Digital study found 26% of firms never respond to a lead and only about 25% respond within five minutes — so being fast alone lifts you above most competitors.
And lead type, because exclusive leads sign at multiples of shared ones. The difference between exclusive and shared is big enough to deserve its own breakdown — see exclusive vs shared leads.
Key takeaways
-
Most marketing dashboards measure vanity. Impressions, clicks, and likes feel like progress and tell you almost nothing about signed cases.
-
Only three metrics matter. Cost per signed case, case value, and the ratio between them decide whether marketing pays.
-
The three connect into one story. Spend becomes leads becomes cases becomes fees; break the chain anywhere and the dashboard lies.
-
You cannot track what you do not instrument. Call tracking and clean source tagging are what make the three metrics real.
-
Good is defined by your own economics. Benchmarks help, but the only pass/fail is whether cost per case sits under case value.
Frequently asked questions
What marketing metrics should a law firm track?
Three: cost per signed case, contact rate, and sign rate. Cost per signed case tells you if marketing is profitable, contact rate tells you if you’re reaching your leads, and sign rate tells you if your intake converts. Clicks, impressions, and cost per lead are vanity metrics that hide those answers.
What is cost per signed case?
It’s your total marketing spend divided by the number of cases you actually signed — not leads or calls, signed retainers. It’s the only metric that speaks the same language as your P&L, because you can compare it directly to what a signed case is worth to your firm. Most well-run WC campaigns land in the four-figure range.
What’s a good contact rate for law firm leads?
Below 40% is poor, 60–75% is good, and above 85% is elite. Contact rate is driven almost entirely by response speed — MIT research shows responding in five minutes rather than thirty makes you up to 100× more likely to reach a lead. Automating an instant first touch is the fastest way to raise it.
Why is cost per lead a vanity metric?
Because it measures the top of your funnel and stays silent about whether those leads ever sign. A $50 lead that never becomes a case is infinitely more expensive than a $150 lead that does. Chasing a lower cost per lead usually means buying worse leads, which quietly raises your true cost per signed case.
What tools do I need to track marketing ROI?
Three that work together: call tracking to attribute each call to a campaign, a CRM to follow every lead from contact to signed case, and one dashboard that divides spend by signed cases per source. The tools are cheap; the discipline is closing the loop by writing the signed-case outcome back into the CRM.
Sources & further reading
-
01
Call tracking & attribution
Call-tracking platforms tie phone calls back to the source that produced them, the data the three metrics depend on.
-
02
Further reading
The three numbers in context.
Benchmarks here draw on WorkersComp Marketing’s own managed-spend data across live firms; your numbers will differ. General marketing information, not legal advice.