Six weeks ago we published a piece on why direct mail does not transfer from personal injury to workers’ compensation. The argument was about a list. A PI firm’s mail program runs on a public police report that names the people in the crash and carries their addresses, and four comp statutes we read close the claim file rather than opening it. There is no comp equivalent of the crash report, and firms that have tried to buy one have bought something else.
That article was right and it stopped one step early. It established that the public record does not name the injured worker. It did not ask whether there is a public record at all.
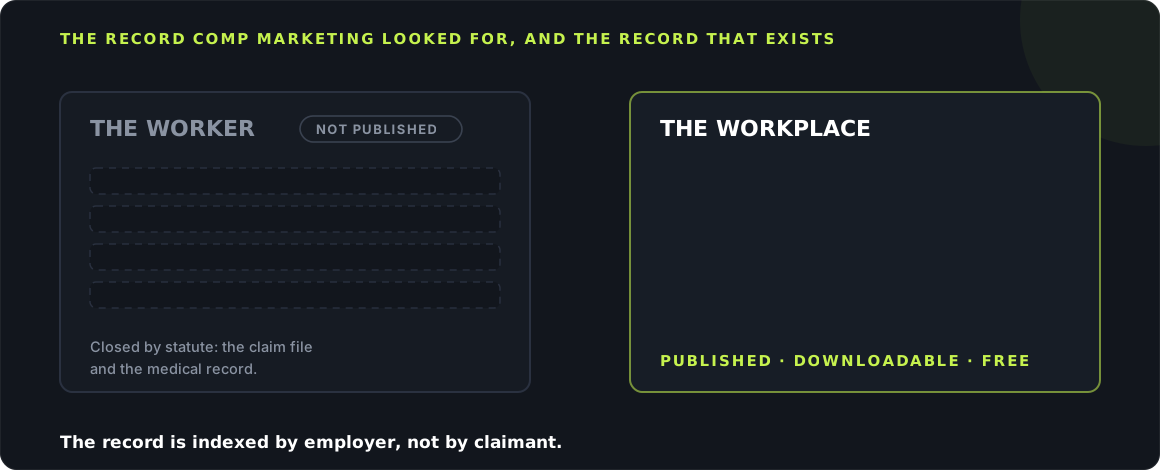
There is. Two of them, both federal, both free, both published as downloadable files with documented field lists. They do not name a single worker. What they name is the workplace — by establishment name, street address, city, state and six-digit industry code — and in one of the two, the date the injury happened.
So the claim of this article, stated plainly: a comp firm’s media plan is the only one in the legal market with no event-level input, and the reason is not that the data does not exist. It is that the data is indexed by employer rather than by claimant, and nobody in this industry ever went looking for it in that shape. Indexed by employer is less useful for a mailing list and considerably more useful for a media buy — and it is the only form of this data that a firm can use without going anywhere near the solicitation rules.
The founding assumption, and the half of it that is wrong
Every comp media plan in the country is built on a geography, because nobody believes there is an event to buy against.
Open any workers’ comp firm’s ad account and you will find the same structure. A radius, or a list of counties, or a state. An age range. A language. Sometimes an interest or behaviour layer that the platform has since deprecated. The campaign is pointed at a population, because the alternative — pointing it at an event — is understood to be impossible.
That understanding is correct about the worker, and we should be precise about why, because the reason is statutory rather than accidental. The documents that would identify an injured worker are the claim file and the medical record, and both are closed. A firm cannot buy them, cannot subscribe to them, and cannot lawfully be sold a copy by anybody who has one.
What nobody checks is the second half of the sentence. A workplace injury is a reportable event in two separate federal systems, and the reporting duty does not sit with the worker. It sits with the employer. An employer is not a person with privacy rights in its own injury rate, and OSHA has treated establishment-level injury information as publishable for a decade.
The consequence is a planning gap you can see in any comp account. A firm in Dallas buys a seventy-mile radius and a demographic, and spends the same money per thousand impressions reaching an office park as it does reaching the industrial corridor where last month’s amputations happened. It is not a targeting failure in the usual sense. It is the absence of a denominator. The firm has never been shown which of its own ZIP codes produce severe injuries, because the data was filed under a heading nobody in legal marketing reads.
What the severe-injury feed actually contains
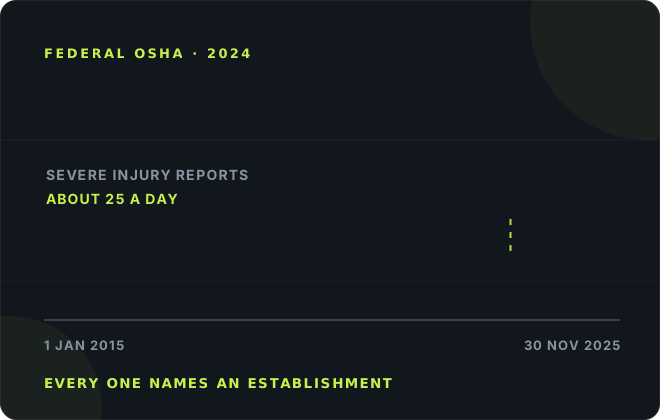
Nine thousand and thirty-four reports in 2024. About twenty-five a day. Each one carries a name and an address.
Since 1 January 2015, an employer under federal OSHA jurisdiction has had to report three categories of non-fatal injury directly to the agency: an in-patient hospitalization, an amputation, and the loss of an eye. OSHA publishes what it receives. The dashboard describes each record as providing “a description of the incident and the name and address of the establishment where it happened,” and the results table is keyed on five columns — event date, industry code, city, state and establishment name. The incidents are classified using the Bureau of Labor Statistics’ occupational injury coding system, so events, sources, natures and body parts are all filterable.
The whole file is downloadable in one click. At the time of writing the download is labelled as covering 1 January 2015 through 30 November 2025, and OSHA says only that the data “will be updated periodically” — there is no published refresh schedule, which matters if you intend to build anything that depends on it.
The volume is the part that surprises people. In OSHA’s own 2024 annual report on the programme: “a total of 9,034 Severe Injury Reports (SIRs), or about 25 SIRs per day.” The National Safety Council, reading the same data independently, publishes the identical figure for 2024 and adds that the series peaked in 2018 at 11,156 cases. Across 2022 and 2023 together OSHA counted 19,690 hospitalizations and amputations under federal jurisdiction, an average it states as 27 a day, down from what it calls a peak of 31 a day in 2018.
Two notes on those figures before anyone builds a model on them. First, the hospitalization and amputation percentages sum to more than 100 because a single report can carry both. Second, and we are going to say this rather than smooth it over: OSHA’s own 2024 report contains a sector rate table whose 2024 total is 9,755, not 9,034, and the document does not explain the difference. We have used the headline figure because it is the one the narrative states and the one the National Safety Council independently matches, but a firm doing its own analysis should expect to reconcile that gap itself.
The twenty-four-hour clock is the whole asset
A dated record is a different instrument from a counted one. This is the only dated injury record in American public data.
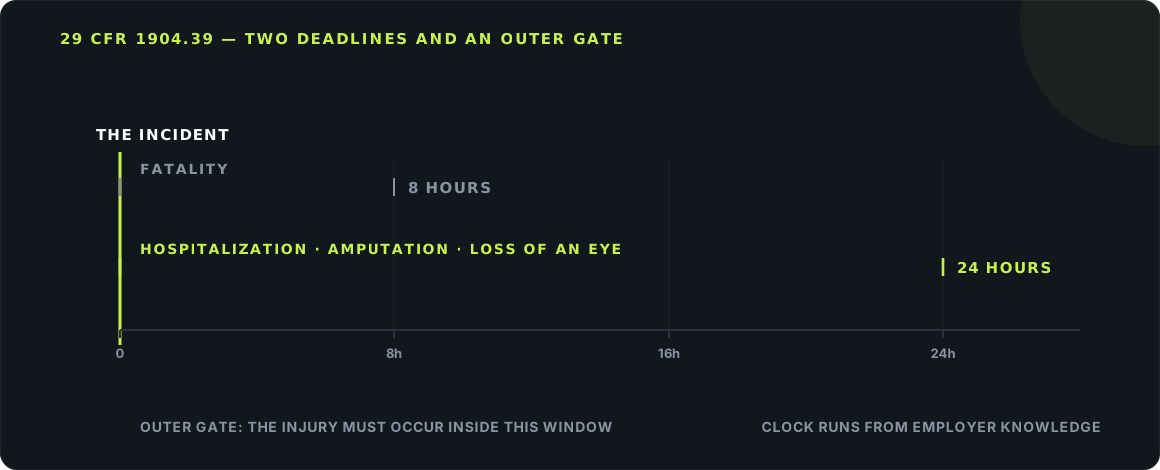
The reporting rule is 29 CFR § 1904.39, and it is short enough to read in full in five minutes. Two deadlines. “Within eight (8) hours after the death of any employee as a result of a work-related incident,” the employer must report the fatality. “Within twenty-four (24) hours after the in-patient hospitalization of one or more employees” — or an amputation, or a loss of an eye — the employer must report that.
The clock has two subtleties that are worth a comp marketer’s attention because they shape what the data can and cannot tell you. The duty is triggered by employer knowledge, not by the event: where the employer learns of the injury later, the same eight- and twenty-four-hour windows run from the moment it or its agent found out. And there is an outer gate on the event itself. A fatality is only reportable if the death occurs within thirty days of the incident; a hospitalization, amputation or eye loss is only reportable if it occurs within twenty-four hours of the incident.
That second gate is the reason this is a feed of acute trauma and not a feed of injuries generally. A worker whose back gives out over eighteen months and who is admitted for surgery two years later generates no report. The cumulative-trauma claim — the single largest category of comp file in several states, and the one with no accident date at all — is structurally invisible here. So is almost everything that gets treated and sent home.
What the clock buys is the one thing counted data never does: it tells you when. Everything else in a comp firm’s data environment is annual and retrospective. Bureau of Labor Statistics incidence rates, which we used to argue that comp advertising is organised around the industry with the most deaths rather than the most claims, arrive once a year and describe a year that has finished. The severe-injury feed describes a Tuesday.
That difference is the difference between a demographic and a trigger. A firm cannot — and must not — use the file to find the worker who was hurt. It can use it to know that the distribution centre on the far side of its county produced four amputations in eighteen months, which is a fact about where to put a billboard, which radio daypart reaches a shift change, and whether the firm’s intake team should expect to hear from that NAICS code at all.
Two datasets, two maps, and California is on the wrong one
The feed is a federal instrument. Twenty-two states took the job over, and the published file follows the jurisdiction rather than the border.
Here is the fact that decides whether any of this is useful to a particular firm, and it is the single most important paragraph in this article.
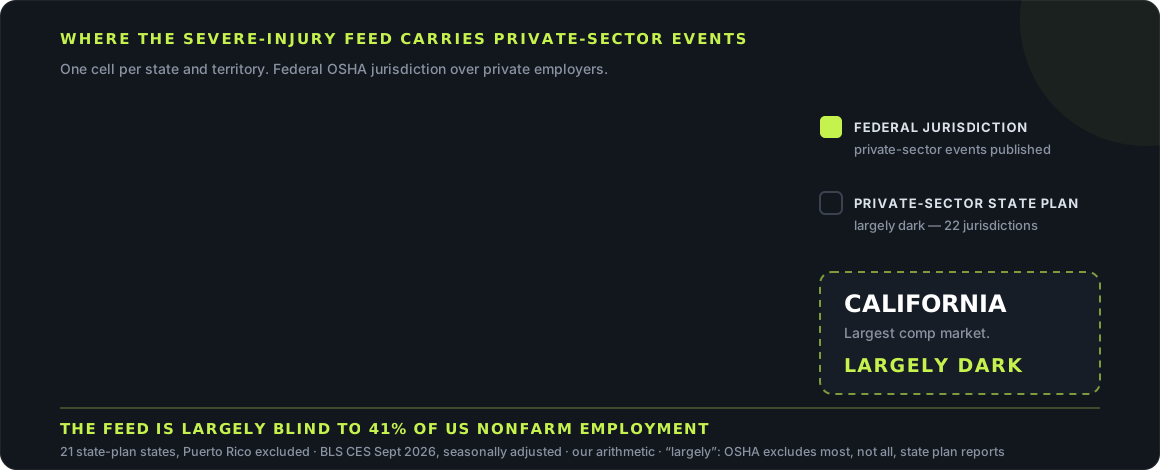
OSHA’s severe-injury dashboard states that the records “represent incidents under federal OSHA jurisdiction only” and that “they do not include incidents under state plan state jurisdiction.” The programme’s 2022–2023 summary puts it slightly differently and more carefully: the dataset and dashboard “do not include most SIRs reported from employers in states covered by state plans.” We have quoted both because the hedge is real — a handful of employers inside a State Plan state remain under federal jurisdiction — and because “most” is the agency’s own word and we are not going to upgrade it to “all” to make a cleaner sentence.
OSHA’s State Plans page gives the count: “There are currently 22 State Plans covering both private sector and state and local government workers, and seven State Plans covering only state and local government workers.” The twenty-two are Alaska, Arizona, California, Hawaii, Indiana, Iowa, Kentucky, Maryland, Michigan, Minnesota, Nevada, New Mexico, North Carolina, Oregon, Puerto Rico, South Carolina, Tennessee, Utah, Vermont, Virginia, Washington and Wyoming. In those jurisdictions a private employer reports to the state, and the severe-injury feed is largely empty of it.
The seven public-sector-only plans are the counter-intuitive half, and they are the half worth knowing. Connecticut, Illinois, Maine, Massachusetts, New Jersey, New York and the U.S. Virgin Islands run plans that cover only state and local government workers. Private employers in those states remain under federal OSHA — which means a comp firm in Chicago, Newark or Buffalo gets the full private-sector severe-injury feed for its own market, while a comp firm in Los Angeles gets close to nothing.
| State | OSHA jurisdiction over private employers | Severe-injury feed |
|---|---|---|
| California | State Plan (private + public) | Largely dark |
| Michigan, Minnesota, Oregon, Washington, Virginia, North Carolina, Tennessee, Kentucky, Maryland, Indiana, Arizona, Nevada and the rest of the 22 | State Plan (private + public) | Largely dark |
| New York, Illinois, New Jersey, Massachusetts, Connecticut, Maine | Federal (the state plan covers public employees only) | Available |
| Texas, Florida, Pennsylvania, Ohio, Georgia | Federal (no state plan) | Available |
How much of the country is that? OSHA does not say, so we worked it out. Taking the Bureau of Labor Statistics’ September 2026 state employment table and summing the twenty-one private-sector State Plan states — Puerto Rico is the twenty-second jurisdiction and is not in the national total — gives 65.4 million of 159.0 million nonfarm jobs. The severe-injury feed is largely blind to about 41 per cent of American nonfarm employment. California alone is 11 per cent of it. As a check on the arithmetic, the fifty states and the District of Columbia sum to 159.03 million against the 159.13 million BLS publishes as the national total for the same month — a 0.06 per cent gap, which is rounding.
The mirror of that number is the part firms get wrong in the other direction. The six public-sector-only plan states — New York, Illinois, New Jersey, Massachusetts, Connecticut and Maine — account for another 16.7 per cent of nonfarm employment, and every private employer in them is in the federal file. A firm in those markets has been told, in effect, that this data does not exist for it, and the opposite is true.
It would be easy to leave California there as a dead end, and it is not one. The report is still made; it is simply made somewhere else, on a tighter clock than the federal rule. California Code of Regulations, title 8, section 342(a) requires that “every employer shall report immediately to the Division of Occupational Safety and Health” any serious injury or illness, or death, of an employee — and defines immediately as “as soon as practically possible but not longer than 8 hours after the employer knows or with diligent inquiry would have known.” Only on a showing of exigent circumstances may the report be made “no longer than 24 hours after the incident.” So California’s duty on a serious non-fatal injury is three times faster than the federal one.
What we could not establish is whether California publishes those reports in anything resembling the federal dashboard. We looked at Cal/OSHA’s own pages and at the Division of Labor Statistics and Research’s statistics area, and what is offered there is the fatal-injury census and sample-based survey estimates — aggregate, not establishment-level. That is a negative result from a search we did not exhaust, not a finding that no such file exists. A California firm that wants this should ask Cal/OSHA directly, and if the answer is that the reports are obtainable, that is a more valuable half-hour than any of the rest of this article.
The annual file: every covered establishment, by name
No dates, no narratives for most of it — but it covers the whole country, California included, and it is a ranking instrument.
The second dataset is the one almost nobody outside safety compliance has heard of, and it is the one that works everywhere. Each year, covered employers submit their OSHA Form 300A summary electronically through the Injury Tracking Application, and OSHA posts the result as a CSV. Summary data has been collected since 2016. Beginning with the 2023 reporting year, some establishments also submit case-level detail from Forms 300 and 301, and OSHA posts that too.
Crucially: “Posted data includes establishments covered by Federal OSHA and establishments covered by a State Plan.” The jurisdictional hole in the severe-injury feed does not exist here.
The field list is not a mystery, because OSHA publishes a data dictionary for each file. The summary dictionary, dated April 2024, documents establishment_name, street_address, city, state, zip_code, naics_code, industry_description, annual_average_employees, total_hours_worked, and the three case-count columns off the 300A form itself — total_dafw_cases (days away from work, column H), total_djtr_cases (job transfer or restriction, column I) and total_other_cases (column J).
| Severe Injury Reports | ITA Form 300A summary | |
|---|---|---|
| Unit of record | One severe injury event | One establishment-year |
| Carries a date? | Yes — event date | No — annual totals only |
| Names the establishment? | Yes — name and address | Yes — name and street address |
| Geographic coverage | Federal jurisdiction only | Federal and State Plan |
| Series begins | 1 January 2015 | 2016 reporting year |
| What it is good for | Timing and acute-trauma geography | Ranking employers by volume and rate |
Who actually files matters for how you read a gap. The 300A submission duty reaches establishments with 250 or more employees that are not in an exempt industry, plus establishments with 20 to 249 employees in a listed set of higher-hazard industries. Case detail comes from establishments with 100 or more employees in a narrower industry appendix. So the file is not a census of American workplaces. It is a census of the larger and more hazardous ones — which, for a comp firm, is a reasonable approximation of where the claims are, and a poor approximation of where the small-employer claims are.
There is also a quiet endorsement of the file’s usability, from the government itself. In May 2025 the Department of Labor announced an update to the inspection programme that “directs agency enforcement resources to establishments with the highest rates of injuries and illnesses,” built “using OSHA Form 300A data from calendar years 2021-2023.” The agency ranks individual American workplaces by injury rate off this exact dataset in order to decide where to send inspectors. A firm that says the file is too messy to rank employers with is making a claim the regulator does not accept about its own data.
One honest word about the case-detail file, because it is the part that gets people excited and it is the part that deserves care. The May 2026 case detail dictionary documents a per-case record with the establishment’s name and address, a case number, a date of incident, an outcome, days away and days restricted, job description, occupation code, and four open-text narrative fields. It documents no employee name, no employee address, no date of birth, no physician and no treatment facility. OSHA states that it “used AI and some manual review” to detect and remove information that could reasonably be expected to identify individuals directly from those narrative fields, and that “in most cases, only a portion of the text is redacted; in some cases an entire field has been redacted.” An AI-assisted redaction pass over free text is a good-faith effort and not a guarantee. If your firm downloads that file, treat the narratives as potentially sensitive material rather than as marketing copy, and do not republish them.
What a firm can legitimately do with it
Four uses, in order of how defensible they are. And one line nobody should cross.
Start with the line, because everything else is easier once it is drawn. Neither file is a prospecting list and neither one can be made into one. There is no worker to contact. The marketing use of this data is geography, timing, industry and message — the inputs of a media plan — and if any part of a proposed use requires knowing who was hurt, the data does not support it and the solicitation rules would not either. We have written at length about where that line sits; this data sits comfortably on the right side of it precisely because it is anonymous as to the worker.
The third use is the one that justifies the title of the article, and it needs the dated file. The severe-injury feed is a running record of acute trauma by place and month. Over a few years in one metro it will tell a firm which employers produce recurring severe events and which produced one bad year — and a recurring pattern at a named large employer is the closest thing comp marketing has to a demand forecast for a particular postcode. We are deliberately not going to dress that up as a lead-generation tactic. It is a media-weighting and capacity-planning input, and the honest framing is that it makes a firm’s existing attribution work harder rather than producing cases on its own.
The fourth is defensive, and unglamorous, and probably the one a managing partner will act on first: it is a sanity check on an agency’s geography. If a firm is paying for county-level targeting and the agency cannot say which of those counties actually generate severe work injuries, the plan was drawn from population data. Ours comes from the same place everybody else’s does until somebody opens these files.
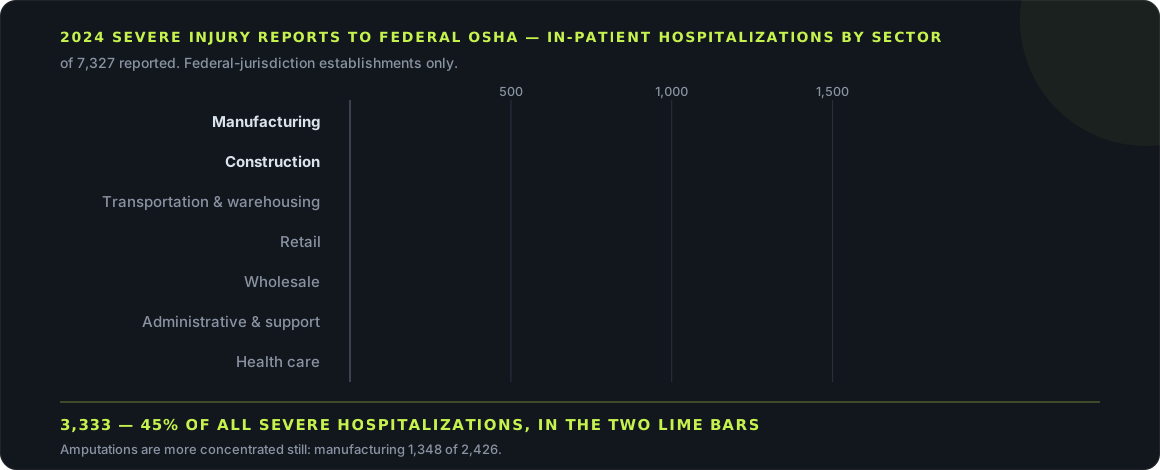
Where the sector concentration lands is worth seeing, because it is sharper than the industry-level story most firms carry in their heads. In 2024, of 7,327 in-patient hospitalizations reported to federal OSHA, manufacturing produced 1,865 and construction 1,468 — the two of them 45 per cent of the total. The amputation picture is more lopsided still: 1,348 of 2,426 amputations came from manufacturing alone, against 231 from construction.
Monday
Three steps, in order of cost. The first one is free and takes an afternoon.
One. Find out which file you are entitled to use. Check your state against OSHA’s State Plans page. If your private employers are under federal jurisdiction, you have both files. If you are in one of the twenty-two, you have the annual file and you have a phone call to make to your state agency about the other.
Two. Download the annual summary file and filter it to your counties. It is a CSV with a documented field list and it will open in any spreadsheet. Sort by case count. Read the industry codes. That single list is more specific than any audience definition in your ad account, and you will have it before lunch.
Three. Put the result next to your current campaign geography and look at the overlap. Not to rebuild the account — to find out how much of your spend is landing where the injuries are not. That number is the business case for everything else, and it is the only one of these steps that requires a conversation with whoever buys your media.
None of this replaces a channel. It corrects an input that has been missing from every comp media plan we have ever audited, including, for a long time, our own. We run a Workers’ Compensation Intelligence Center built on Bureau of Labor Statistics and Census data covering 3,142 named counties, and it is an annual, aggregate instrument like every other one in this market. The employer-level files are a different kind of object, and we had the same blind spot as everybody else about where to look for them.
Key takeaways
-
The public record is indexed by employer, not by claimant. Comp firms looked for a crash-report equivalent, found none, and stopped. Two federal files name the workplace.
-
The severe-injury feed is dated. 9,034 reports in 2024, about 25 a day, each with an event date, city, industry code and establishment name — the only dated injury record in US public data.
-
It is acute trauma only. The injury must occur within 24 hours of the incident to be reportable, so cumulative trauma never appears.
-
It is largely dark across about 41% of US employment. That is our sum of the 21 State Plan states, California included. New York and Illinois private employers are covered — their plans are public-sector only.
-
The annual 300A file covers everybody. Establishment name, street address, industry code and case counts, State Plans included — the file OSHA itself uses to rank workplaces for inspection.
-
It is a media input, never a list. No worker is named and none can be contacted. The use is geography, timing, industry and message.
WorkersComp Marketing is a marketing agency, not a law firm. This article describes two federal recordkeeping rules — 29 CFR § 1904.39 and the Injury Tracking Application reporting requirements — and one California regulation, 8 CCR § 342, and it describes them to explain what the resulting public files contain. Nothing here is legal advice, and nothing here is advice about your professional-conduct or advertising obligations. Rules on client solicitation and the use of information about identifiable individuals are set state by state and differ; whether a particular intended use of a public dataset is permissible for your firm is a question for your own counsel, not for us. Reporting rules and published file contents change — the pages and dictionaries quoted here were read on 12 November 2026.
Frequently asked questions
Can we use this to contact injured workers?
No, and the reason is structural rather than a matter of restraint. Neither file contains a worker. The severe-injury dashboard publishes an event date, an industry code, a city, a state and the establishment’s name and address; the annual summary file publishes establishment identifiers and case counts; and the case-detail file’s documented field list contains no employee name, address, date of birth, physician or treatment facility. There is nobody in the data to contact. That is also why these files are usable at all: the entire marketing application is geography, timing, industry and message, which are the inputs of a media plan and have never required a name. If any proposed use of this data depends on identifying who was hurt, the data does not support it and your state’s solicitation rules almost certainly would not either.
We are in California. Is there anything here for us?
The annual file, yes, in full — OSHA states that the posted Injury Tracking Application data includes establishments covered by a State Plan as well as those under federal OSHA, so a California firm can rank the covered establishments in its counties by case count and by rate exactly as a Texas firm can. The severe-injury feed is the part you largely lose, because OSHA publishes it for federal jurisdiction only. The underlying reports still exist: 8 CCR § 342(a) requires a California employer to report a serious injury, illness or death to Cal/OSHA within eight hours of knowing about it, which is a tighter clock than the federal rule’s twenty-four. What we could not establish is whether Cal/OSHA offers those reports as a public dataset comparable to the federal dashboard. We looked and did not find one, in a search we did not exhaust. Asking the Division directly is worth a half-hour of somebody’s time.
Is the data good enough to make decisions on?
It depends which decision. OSHA attaches an explicit warning to the annual file: it “does not validate the employee or injury and illness counts reported by establishments.” These are self-reported figures with no audit behind them, and under-reporting in injury recordkeeping is a documented problem. So we would not treat any single establishment’s count as accurate. We would treat the relative ranking between establishments and the geographic distribution as a strong signal, which is the same way the Department of Labor treats it — its May 2025 inspection-targeting update directs enforcement resources to the establishments with the highest rates using Form 300A data from 2021 to 2023. A regulator sending inspectors on the strength of a file is a reasonable floor for a marketing agency weighting a media buy with it.
Why have we never heard of these files?
Because they are catalogued for a different profession. Both datasets live in OSHA’s recordkeeping and enforcement area and are written for safety and compliance professionals, employer-side counsel and researchers. The search queries that lead to them are about recordkeeping obligations and inspection targeting, not about client acquisition, and the small industry that has built tools on top of them sells to safety vendors. Nothing was hidden. The files were simply never indexed under any phrase a legal-marketing team would type, and the one phrase that would have found them — a public record of workplace injuries — returns the answer that no such thing exists, because everybody asking the question meant a record of injured people.
What does the severe-injury feed miss?
A great deal, by design, and knowing what is absent is most of using it well. It excludes fatalities, which OSHA keeps separately. It covers three defined categories only: in-patient hospitalization, amputation and loss of an eye — and the rule’s own definitions exclude observation and diagnostic testing from the first, and avulsions, deglovings, scalpings, severed ears and broken teeth from the second. It carries an outer gate requiring the injury itself to occur within twenty-four hours of the incident, which removes cumulative-trauma claims entirely. And it is federal jurisdiction only. The net effect is a feed of acute, severe, single-event trauma at larger employers — a minority of comp claims, weighted towards the expensive end.
Does this change what we should pay for a lead?
Not on its own, and we would distrust anyone who said it did. What it changes first is the denominator under your geography. A firm that discovers half its county spend is landing in places that produce no severe work injuries has found a reallocation, not a bid increase — the same budget, weighted differently. Any effect on what a lead is worth comes later and indirectly, through case mix: if industry weighting shifts the kind of claim that arrives, the value side of the equation moves too, and that has to be measured in your own signed-case data before it goes anywhere near a bid. Treat this as a correction to where money goes, not as a reason for there to be more of it.
Sources
-
01
The severe-injury dashboard
OSHA: the data provides “a description of the incident and the name and address of the establishment where it happened”; the records “represent incidents under federal OSHA jurisdiction only” and “do not include incidents under state plan state jurisdiction.” Download labelled 1/1/2015–11/30/2025, updated “periodically” with no published schedule. Excludes fatalities. We did not read the file or any dictionary for it, so we make no claim that its narrative text is de-identified.
-
02
The reporting rule
29 CFR § 1904.39: a fatality “within eight (8) hours”; “within twenty-four (24) hours after the in-patient hospitalization of one or more employees,” an amputation or a loss of an eye. Hospitalization means formal in-patient admission, so observation alone is exempt; amputation excludes avulsions, deglovings, scalpings, severed ears and chipped teeth. The 24-hour outer gate on the injury itself, and the employer-knowledge trigger, are at (b)(6)–(b)(8).
-
03
The 2024 counts
OSHA 2024 annual report: “a total of 9,034 Severe Injury Reports (SIRs), or about 25 SIRs per day”; 7,327 hospitalizations and 2,426 amputations, categories overlapping; manufacturing 1,865 and construction 1,468 hospitalizations. Unresolved: its sector rate table totals 9,755 for 2024, unexplained. The eye-loss count did not extract legibly and is not quoted. The 45 per cent is our arithmetic.
-
04
The 2022–2023 summary, and the jurisdiction hedge
OSHA: “19,690 Inpatient hospitalizations and amputations … under federal OSHA in 2022 and 2023”; “an average of 27 … per day,” below “the peak of 31 SIRs per day reported in 2018.” The dataset “do[es] not include most SIRs reported from employers in states covered by state plans” — most, not all, hence “largely dark.” Per-year 2022 and 2023 tables did not extract and are not quoted.
-
05
Independent corroboration of the 2024 figure
National Safety Council: “There were 9,034 cases in 2024,” the series having “peaked in 2018, with 11,156 cases” — an exact match to OSHA’s headline from a second publisher. NSC’s account of which states are excluded does not reconcile internally, so State Plan counts here come from OSHA’s page, not NSC.
-
06
The annual establishment file and its field list
OSHA ITA page: “Posted data includes establishments covered by Federal OSHA and establishments covered by a State Plan”; summary since 2016, case detail since 2023. Summary dictionary (April 2024) documents establishment_name, street_address, city, state, zip_code, naics_code, annual_average_employees, total_hours_worked and the three 300A case-count columns. OSHA “does not validate the … counts reported by establishments.” The case detail dictionary (May 2026) documents no employee name, address, date of birth, physician or facility; OSHA “used AI and some manual review” to strip identifying narrative text, sometimes only “a portion” — good faith, not a guarantee. We read the dictionaries, not the CSVs.
-
07
Which states run their own plan
OSHA: “There are currently 22 State Plans covering both private sector and state and local government workers, and seven … covering only state and local government workers.” Both are enumerated there; every state in this article’s table was checked against those lists individually, not inferred.
-
08
The regulator ranking workplaces off the same file
US Department of Labor, 20 May 2025: the updated inspection programme “directs agency enforcement resources to establishments with the highest rates of injuries and illnesses,” “using OSHA Form 300A data from calendar years 2021-2023.” Cited only to show the file supports establishment-level ranking.
-
09
California — the clock, and what we could not establish
8 CCR § 342(a): report “immediately” a serious injury, illness or death, meaning “not longer than 8 hours after the employer knows or with diligent inquiry would have known,” or “no longer than 24 hours after the incident” on exigent circumstances. Read at DIR’s own Title 8 site (official publisher) and corroborated word for word at Justia, whose copy is current only through the September 2024 register. Cal/OSHA and DLSR offer only the fatal-injury census and sample-based estimates, aggregate rather than establishment-level: a negative result from a search we did not exhaust, not proof no such dataset exists.
-
10
The 41 per cent — our calculation
BLS, Employees on nonfarm payrolls by state, September 2026 preliminary, seasonally adjusted. The twenty-one private-sector State Plan states sum to 65.4m of the 159.0m in the fifty states and DC. Ours, not BLS’s: BLS publishes the state figures, the division is our arithmetic. Total nonfarm includes government. Puerto Rico is excluded because it is not in the national total. State figures are September and preliminary; the national control total we checked against is the November vintage.
Federal reporting rules and the contents of published files change — confirm against the official source before relying on any of it. Firm figures quoted here (~$16.5M managed Meta spend, ~219,000 leads at ~$75 CPL, ~21,000 signed cases at ~$775) are our own aggregate results, not an industry benchmark. Pages and data dictionaries read 12 November 2026. General business information from a marketing agency, not legal advice.