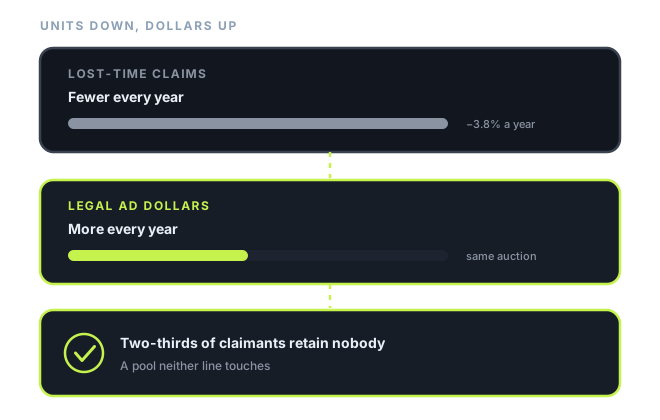
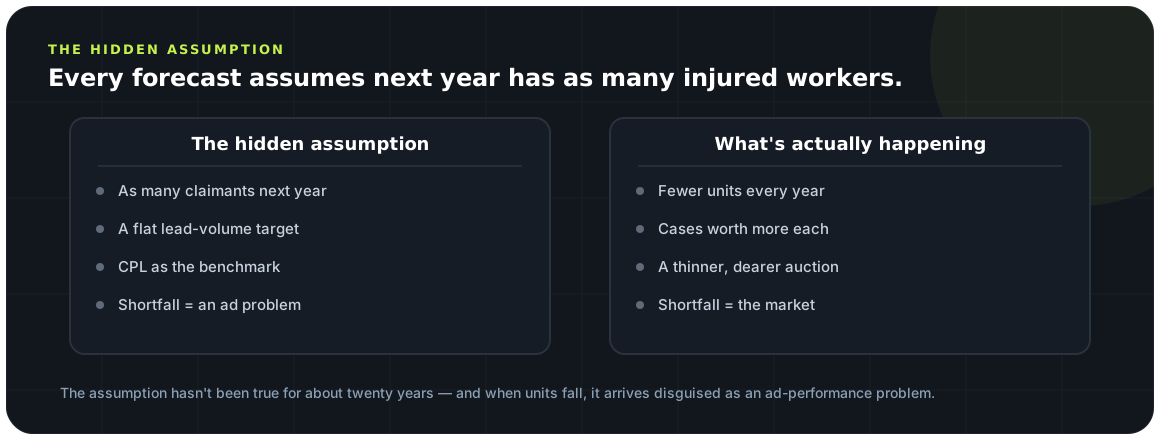
Every marketing forecast a comp firm writes contains a hidden assumption, and it is almost never stated: that next year there will be at least as many injured workers looking for a lawyer as there were this year. Everything else in the plan — the lead target, the cost-per-lead benchmark, the “we want 20% more cases” — sits on top of that assumption. It has not been true for about twenty years.
This is not a claim about a bad quarter or a soft economy. It is a claim about the shape of the category. Work is getting safer and the mix of work is shifting away from the industries that produce the most lost-time claims per worker. The number of compensable injuries per employed person has been falling, steadily, through booms and recessions alike, for longer than most firms have had a marketing budget.
The interesting part is what is happening on the other side of the ledger, and how completely it is absent from the conversation.
So the claim: workers’ compensation is losing units and gaining value, and the two halves belong in the same forecast. A firm whose plan grows by buying more leads from the same audience is levered to the only number in the market that structurally declines. The three numbers that do not decline — the share of claimants who retain nobody, the share of enquiries a firm converts, and the value of the cases it accepts — are where the growth actually is, and none of the three is bought with media.
The scissor: fewer claims, dearer media
Two lines moving in opposite directions produce one symptom, and the symptom looks like a creative problem.
Start with the supply of injured workers, because it is the input every other number in a comp firm’s marketing depends on and almost nobody looks it up.
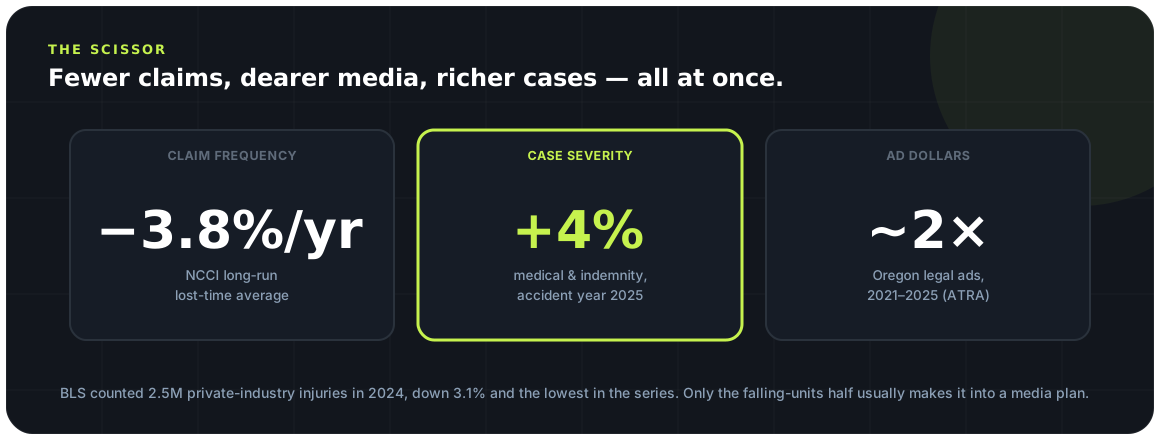
The Bureau of Labor Statistics publishes an annual count of employer-reported nonfatal injuries and illnesses in private industry. For 2024 that count was 2.5 million, down 3.1% on 2023, and the BLS says plainly that it is “the lowest number of employer-reported injuries and illnesses for this data series going back to 2003”. The rate tells the same story with employment growth taken out of it: 2.3 recordable cases per 100 full-time-equivalent workers, down from 2.4, and again the lowest in the series. The subset that matters most to a claimant firm — cases involving days away from work — ran to 1.8 million over the two-year 2023–2024 period, an annualised rate of 86.6 per 10,000 FTE workers, with a median of eight days away.
The insurance side measures the same phenomenon from a different set of records and reaches the same place. NCCI’s 2026 State of the Line estimates lost-time claim frequency for accident year 2025 at 2% below 2024, and notes that this is “a more moderate decrease in frequency compared to the three previous accident years, along with the long-term average annual change of −3.8%”. Read that carefully: a 2% decline is the good year. The long-run pace is nearly twice that.
Now the other blade. While the pool of claims shrinks, the number of dollars chasing it does not. ATRA’s state-level reports are the most granular public figures we could find on legal-services advertising, and we flag the source honestly: ATRA campaigns against plaintiff advertising and therefore has an institutional interest in the number being large. The national headline — roughly $4 billion across more than 30 million legal-services ads in 2025, up about 44% on 2024 — is a jump big enough that we would treat the level as more trustworthy than the year-over-year change, which smells of methodology rather than market.
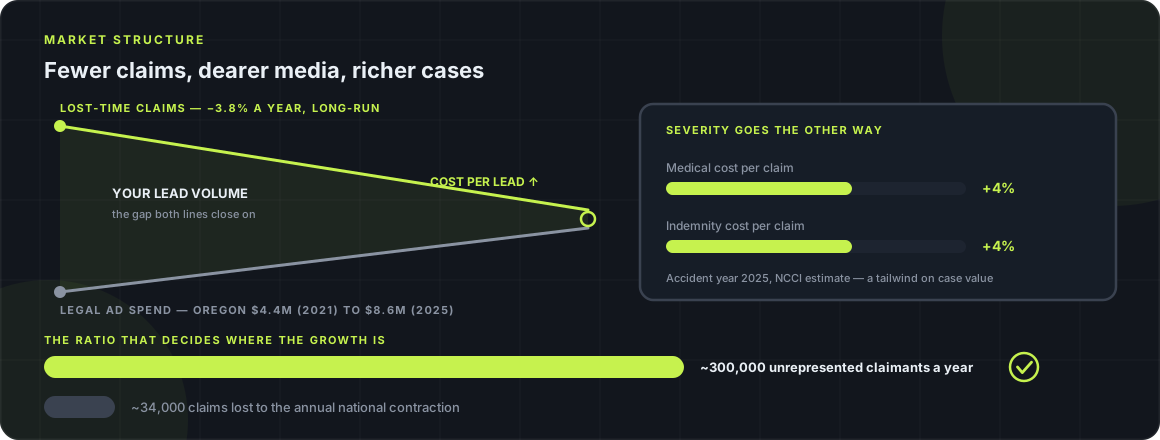
The state series behaves better, and it contains the detail worth the whole section. In Oregon, ATRA puts local legal-services advertising at about $4.4 million in 2021 and more than $8.6 million in 2025. Over the same period the number of local legal ads fell, from roughly 196,000 to roughly 181,000. Spend nearly doubled; volume declined about 8%. Whatever you think of the source, those two series were produced the same way in the same market four years apart, and the implied price per ad went from about $22 to about $48.
| What is being measured | Direction | Figure | Source |
|---|---|---|---|
| Employer-reported injuries & illnesses, private industry | Down | 2.5M in 2024, −3.1% year over year; lowest count in the series back to 2003 | BLS, Jan 2026 release |
| Recordable case rate per 100 FTE | Down | 2.3 in 2024, from 2.4; lowest in the series | BLS |
| Lost-time claim frequency | Down | −2% for accident year 2025; long-term average annual change −3.8% | NCCI, 2026 State of the Line |
| Medical severity per lost-time claim | Up | About +4% for accident year 2025 | NCCI |
| Indemnity cost per claim | Up | About +4% for accident year 2025, attributed largely to wage inflation | NCCI |
| Local legal-services ad spend, Oregon | Up sharply | ~$4.4M (2021) to >$8.6M (2025), while ad count fell ~196,000 to ~181,000 | ATRA (advocacy source) |
Put the blades together and you get the experience every comp firm has actually had for the last several years: cost per lead drifts up, and it drifts up in a way that no amount of creative testing explains. We have argued separately that most creative tests at law-firm volume cannot produce a trustworthy answer, which means a firm facing structural price inflation has no instrument sensitive enough to tell it that the price rise is structural. So the rise gets attributed to the thing the firm was changing at the time. New creative, a new agency, a new platform, a new round of the same conversation.
Why this does not reverse
A recession is cyclical. This is compositional, and composition does not bounce back.
We have written before that the reflex to cut marketing first in a downturn is backwards, because injured-worker demand is non-discretionary and the ad auction thins when competitors go dark. That argument is about a cycle. This one is not, and the difference is the whole reason this article exists.
The decline in injury frequency has persisted through expansions and contractions, through tight labour markets and slack ones. The drivers are structural: genuine improvements in workplace safety practice and equipment; automation of the specific tasks that produce the most lost-time injuries; and, most importantly for a marketer, a long shift in the composition of employment away from goods-producing work toward service and knowledge work with far lower injury rates per worker. None of that unwinds when GDP recovers. A firm waiting for the pool to come back is waiting for the industrial structure of the United States to reverse.
There is one honest complication, and it deserves to be stated rather than buried. The BLS survey is built on what employers record. There is a long-standing research literature arguing that it undercounts, and if that undercount is worsening over time then some share of the measured decline is bookkeeping rather than fewer hurt people. We cannot resolve that from public data and we are not going to pretend otherwise. Two things keep the conclusion standing anyway. NCCI’s series comes from insurance claims rather than employer logs, and it points the same direction. And from a purely operational standpoint, an injury that is never reported is also never a lead — so an averted injury and a suppressed one look identical from inside a marketing department. The distinction matters enormously for safety policy. It changes nothing in a media plan.
A firm waiting for the pool of claims to come back is waiting for the industrial structure of the country to reverse.
The half nobody puts in the plan: severity
The same report that says there are fewer claims says each one is worth more. Firms read the first sentence and stop.
NCCI’s 2026 State of the Line estimates average medical severity per lost-time claim up about 4% for accident year 2025, and average indemnity cost per claim up about 4% as well, the latter attributed largely to elevated wage inflation in recent years. Those two numbers are printed a few lines from the frequency estimate. In every conversation we have had with a managing partner about market conditions, the frequency number came up and the severity numbers did not.
The reason they matter to a marketing budget is mechanical rather than sentimental. Claimant fees in workers’ compensation are not a marketing decision; they are, as we have argued at length, a paraphrase of the fee statute. In most states the fee is a capped percentage computed against the indemnity recovered and approved by a judge or the board. Where the cap is expressed as a percentage, wage inflation lifting indemnity lifts the fee base along with it. That is the channel through which a 4% severity increase arrives in a firm’s revenue without the firm doing anything at all.
It is not universal and we will not overstate it. Where a state fixes a flat dollar ceiling on the fee, the cap is nominal: inflation erodes it every year until a legislature moves it, and severity growth stops at the carrier. So the value half of this argument is strong in percentage-cap states and weak in flat-cap ones, and any firm leaning on it should read its own statute rather than this paragraph. What holds everywhere is the direction of the two series, and the fact that they point opposite ways.
Now do the arithmetic that a forecast should contain and almost never does. Take a firm signing 200 cases a year. Suppose the category loses 3% of its claims and the firm holds its share exactly — it signs 194. Suppose the value of each case rises 4%. Revenue is up about 1%. Holding share in this market is roughly revenue-flat, which is a much better outcome than the volume line suggests and a much worse one than the phrase “we grew” implies.
Then run it the other way, which is the number worth writing on a whiteboard. For that same firm to grow revenue 10%, it needs about 6% more signed cases. In a market that shrank 3%, 6% more cases is about a nine-point share gain. That is the real ask inside an ordinary-sounding growth target, and until somebody states it in those terms the plan will keep being written as though the firm were fishing in a pond that refills.
| What the firm does | Signed cases | Share of a shrinking market | Revenue vs last year | How it reads internally |
|---|---|---|---|---|
| Nothing changes; share held | 194 | Flat | About +1% | “Volume is down, something is wrong” |
| Volume held at 200 | 200 | +3 points | About +4% | “Flat year” — in fact a share gain |
| Revenue target of +10% | ~212 | +9 points | +10% | “A reasonable stretch goal” |
| Lead target of +10% from the same audience | Depends on close rate | +13 points of leads | Unstated | “Just ask the agency for more volume” |
The pool that is not shrinking
The constraint on a comp firm has never been the supply of injuries. It is the decision to hire anybody.
Here is the turn, and it is the reason a shrinking category is not the bad news it first looks like.
A firm does not sell to injured workers. It sells to injured workers who decide to retain counsel, and that share is nowhere near one. WCRI’s 2024 analysis of more than 950,000 claims across 31 states, all with more than seven days of lost time, found that 34% of those workers had an attorney represent them. Two-thirds did not. Representation tracked the shape of the benefit almost exactly — 14% where only temporary disability was paid, 38% where permanent partial disability was involved, 79% where there was both PPD and a lump sum — which tells you it is driven by what is at stake rather than by anybody’s advertising.
Now put the two datasets side by side, carefully, because they do not measure the same universe and pretending otherwise would be exactly the kind of arithmetic we criticise elsewhere. BLS counts 1.8 million days-away-from-work cases over two years in private industry, so roughly 900,000 a year, with a median of eight days away. WCRI’s universe is claims with more than seven days lost. If we take the median at face value, something in the order of half the BLS cases clear that bar — call it 450,000 a year, and treat that as an order of magnitude rather than a figure. Two-thirds of those retain nobody. That is roughly 300,000 unrepresented lost-time claimants a year.
Against that, the national annual contraction. Three point eight per cent of 900,000 lost-time cases is about 34,000 claims.
The pool of people who had a real claim and hired nobody is something like nine times the size of the entire national annual contraction. Every caveat in the previous paragraph applies — private industry only, two mismatched universes, a survey with a known undercount, a median standing in for a distribution — and the conclusion survives all of them, because it does not depend on precision. It depends on one ratio being large, and it is large by an order of magnitude.
So the honest statement of a comp firm’s growth problem is not “there are fewer injuries”. It is that the category has spent decades competing for the third of claimants who had already decided to hire somebody, and treating the other two-thirds as though they were not in the market. We have made the sharper version of this argument elsewhere: in most states the default alternative to hiring your firm is a free state advocate, advertised by law on the wall of your prospect’s workplace, and virtually no firm’s marketing acknowledges it exists. The shrinking-category data is the reason that stops being an interesting observation and becomes a budget decision.
There is a second uncomfortable implication for anyone who buys leads. If the pool of claims is contracting a few per cent a year and the number of bidders is not, then the lead vendors sitting between the claimant and the firm are competing for a shrinking inventory too — and the pressure that creates shows up as wider distribution of the same enquiry, not as a lower price. That is a structural argument for where a lead comes from mattering more each year, not less.
The figure below is the whole argument in one frame: the two blades of the scissor closing on the volume line, and underneath it the pool that neither blade touches.
Four things it changes in a media plan
None of them is “spend less”. All of them are about what the plan promises and how it is judged.
The practical consequences are narrower than the argument, which is how you can tell the argument is doing work rather than posturing. Four changes, in the order they bite.
One: put the category trend in the forecast as an explicit line. Not a footnote — a line, with a number on it, in the band the published data supports. A plan that starts from last year’s lead count and multiplies is starting from a number that has since decayed. Once the decay is visible, every target above it is legible as a share demand, which is the only way the media budget attached to it can be sized honestly.
Two: change what counts as a flat year. This is the expensive one, because the usual response to “flat” is to change something that was working. In a category losing 2% to 4% of its claims annually, flat lead volume from a flat budget is a small share gain. A firm that fires a channel for going sideways in that environment is firing a channel that beat the market. We have argued elsewhere that most month-to-month movement in a comp firm’s case count is noise rather than signal; this adds a slow, invisible downward pull underneath the noise, which makes the read harder rather than easier and makes patience more valuable, not less.
Three: send the incremental dollar to the variables that are not shrinking. If you have one more dollar and three places to put it, the contraction argument is a tiebreaker rather than a revolution: media efficiency is being fought over by every other bidder in a shrinking pool, while conversion and case value are fought over by nobody but you. That does not mean stop buying media. It means that when the marginal media dollar and the marginal intake dollar look equally attractive on paper, the intake dollar has the structural tailwind.
Four: choose markets on injury-generating industry mix, not population. The contraction is compositional, so it is not evenly distributed. A county built on warehousing, construction, transportation and long-term care is not experiencing the same market as a county that added ten thousand remote roles. Industry-by-county employment is public data — it is the basis of our own Workers’ Compensation Intelligence Center, which carries BLS and Census figures for 51 states and 3,192 counties — and it belongs in a second-market decision ahead of competitive density, which is where most firms start.
| Input | The usual reading | What the contraction data implies |
|---|---|---|
| Last year’s lead count | The baseline to grow from | A number that has decayed 2–4% before you start; the baseline is last year minus the trend |
| A flat month or quarter | Stagnation; something needs changing | A small share gain; changing something is the risk, not the remedy |
| Rising cost per lead | An execution or creative problem | Partly structural: fewer claims, more advertising dollars, same auction |
| Market selection | Population and competitive density | Injury-generating industry mix first, then the state’s propensity to retain counsel, then density |
The three levers, priced
Three ways to grow in a shrinking category. Only one of them is what most firms try first, and it is the hardest.
If volume in the existing audience is the wrong lever, what is left? Three things, and they can be ranked by how much they move for how much effort — which is a different ranking from the one firms actually use.
Conversion. Cost per signed case is cost per lead divided by the share of leads that sign, which means the close rate is the most leveraged number in the whole system. Across our own book — about $16.5M of managed workers’ comp Meta spend, roughly 219,000 injured-worker leads at about $75 each and roughly 21,000 signed cases — the blended close rate is about 9.6% and the cost per signed case lands near $775. Move the close rate one percentage point, to 10.6%, and the same $75 lead produces a signed case at about $708. That is a 9% improvement in the number that actually matters, bought with no additional media at all, and it is available to a firm that changes nothing about its advertising. The reason it goes unclaimed is that the leaks are invisible from inside the firm, which is why we published a scoring instrument for them rather than advice, and why the Workers’ Comp Intake Playbook in the Growth Library is the volume we hand a firm first.
Category conversion. The larger and slower version of the same lever: persuading some part of the unrepresented two-thirds that their situation is the kind where representation changes the outcome. This is a content and positioning job rather than a media one, because the question being answered is “does anyone need a lawyer for this” and comparative advertising is wasted on it. It is also the only lever whose ceiling is set by the size of a pool nobody is currently fishing in.
Case value. The highest ceiling and the slowest to move, because it means changing what the firm accepts rather than how it advertises. We have written separately on what a comp case is actually worth and on which cases to market for; the relevance here is that severity rising 4% a year is a tailwind on this lever specifically, and a firm that knows its own median fee can tell whether it is catching that tailwind or watching it go past.
| Lever | What it costs to move | Ceiling | Who has to do the work | Effect on cost per signed case |
|---|---|---|---|---|
| Close rate (conversion) | Process discipline; little or no media | Bounded by the quality of the enquiries you already buy | Intake, not marketing | Direct and immediate: +1 point takes ~$775 to ~$708 |
| Category conversion | Content, positioning, patience measured in quarters | Large — roughly two-thirds of lost-time claimants retain nobody | Marketing and the partners, jointly | Indirect: raises the share of traffic that can profitably sign |
| Case value | Changing what the firm accepts and how it is staffed | Highest, and helped by severity rising ~4% a year | The partners | None directly; it changes what a given cost is worth paying |
| Media efficiency (for comparison) | Constant work against every other bidder | Shrinking with the pool it bids into | The agency | Real but contested; the hardest of the four to hold |
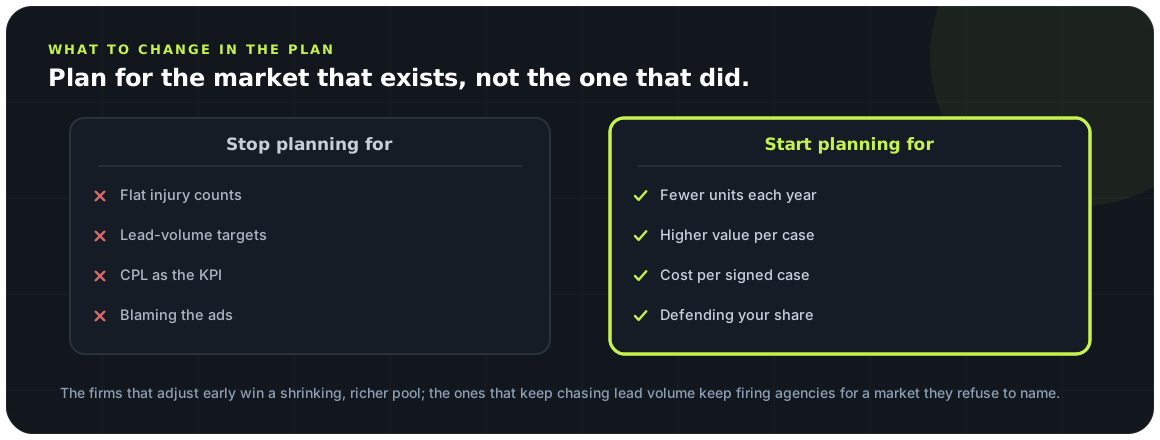
The build: one afternoon, three numbers
Nothing here needs a new platform, a new vendor or a new budget. It needs three numbers written down where the plan can see them.
Do this in the order given, because each step makes the next one readable.
Write the category trend into the plan. One line, −2% to −4%, sourced to NCCI, applied to last year’s lead count to produce this year’s honest baseline. Every target then sits visibly above or below it. This takes about ten minutes and it is the only step that changes how every other number is read.
Restate the target in cases and cost per signed case. Leads are a purchasing metric, and in a contracting market they are a purchasing metric attached to a shrinking inventory. If the firm wants 10% more revenue, write down the case count that implies and the share gain it implies, and put both in front of whoever approves the budget. We build this arithmetic into the Growth Assessment and the Growth Advisor, both free, but a spreadsheet does it equally well.
Get your close rate to one decimal place. Not an impression of it — the actual figure, signed cases divided by enquiries, over a trailing window long enough to allow for the lag between the two. This is the number the whole contraction argument routes into, because it is the one lever that pays immediately and is not contested by another bidder. If the figure cannot be produced from your systems, that is itself the finding, and it is the most common one we encounter.
Then re-read your own last four quarters against the trend. Not to feel better about them — to find the channel you were about to cut that was actually beating the market, and the one you were praising that was merely keeping pace with a rising price. Both exist in almost every account we have audited, and neither is visible until the category line is drawn.
Key takeaways
-
The category is shrinking. Lost-time claim frequency has fallen at a long-run average near 3.8% a year, and 2024 produced the fewest employer-reported injuries in the history of the BLS series.
-
Media went the other way. Legal advertising kept getting more expensive — in some states the same volume of ads now costs roughly twice what it did. Fewer claims, dearer clicks: a scissor.
-
This does not reverse. The decline is structural — safer workplaces, automation, a shift out of injury-heavy industries — not a cyclical dip. A plan that assumes flat volume is planning for a market that isn’t coming back.
-
Severity is the half nobody plans for. As frequency falls, the claims that remain get larger and more complex. The category loses units and gains value at the same time.
-
Compete on value, not volume. The serious, represented claims worth the most are the stable core. The growth move is to shift the plan toward the three numbers a firm can still grow, not to chase an injury count that is no longer rising.
Frequently asked questions
Isn’t a shrinking category just an argument for spending less?
No, and the inversion is the point. The category is shrinking in claims and growing in value: NCCI puts the long-run average annual change in lost-time claim frequency at −3.8% while estimating both medical and indemnity severity up about 4% for accident year 2025. A market with fewer, more valuable units is not a market to withdraw from — it is a market where the return on winning a given case rises while the cost of finding one also rises. What it argues against is a specific habit: writing a plan whose growth comes from volume in the same audience. The honest version of the plan says what share you intend to take, from whom, and what you will do to sign more of what you already buy.
How is this different from the recession argument?
A recession is cyclical and it reverses. This does not. Employer-reported injuries in private industry have been trending down for two decades — 2024 was the lowest count and the lowest rate in a data series that starts in 2003 — and NCCI has been reporting frequency declines for far longer than that. Nothing in an economic recovery brings those claims back, because the decline is driven by what work is and how it is done rather than by how much of it there is. The one thing that genuinely moves the addressable pool in a hurry is statutory: a change in what is compensable, in fee rules, or in the dispute process. That is why we argue elsewhere that firms should hold marketing through a downturn, and argue here that they should stop forecasting volume growth even in a good year. Those are not in tension.
Are injuries really falling, or are they just being reported less?
Both are plausible and we are not going to pretend the data settles it. The BLS Survey of Occupational Injuries and Illnesses is built on what employers record, and researchers have argued for years that it undercounts. If the undercount is worsening, some of the measured decline is bookkeeping. Two things keep the conclusion intact anyway. First, NCCI’s frequency series comes from insurance claims rather than employer logs, and it points the same way. Second, and more practically, a claim that is never reported is not a lead either — so from a marketing standpoint an unreported injury and an averted one look identical. The distinction matters enormously for safety policy and very little for a media plan.
Our lead volume is flat year over year. Is that good or bad?
In a category losing 2% to 4% of its claims a year, flat volume from the same media budget is a small share gain, and most firms book it as a failure. This is the single most expensive misreading in the article, because the usual response to “flat” is to change something that was working. Write the category trend into the target before the year starts: if the plan says leads must rise 10% and the pool is falling 3%, the channel is being asked for 13 points of share and nobody has said so out loud. Then hold the judgement at the level that actually pays — cost per signed case — rather than at lead count, which is a purchasing metric.
Which of the three levers should we pull first?
Close rate, almost always, and the arithmetic is why. Cost per signed case is cost per lead divided by the share of leads that sign. Across our own book that is roughly $75 and roughly 9.6%, which lands at about $775 a signed case. Moving the close rate by one percentage point, to 10.6%, takes the same $75 lead to about $708 — a 9% improvement bought with no additional media at all. Media efficiency is the lever firms reach for first and it is the hardest of the three, because you are bidding against everyone else’s improvement. Case value is the highest-ceiling lever and the slowest, because it means changing what the firm accepts rather than how it advertises.
Does rising severity actually reach the firm, or just the carrier?
Partly, and the mechanism is worth knowing precisely because it is not universal. Claimant fees in comp are set by statute: typically a capped percentage computed against the indemnity recovered, approved by a judge or the board. Where the cap is a percentage, wage inflation lifting indemnity lifts the fee base with it — that is the channel through which NCCI’s 4% severity increase reaches a firm’s revenue without the firm doing anything. Where a state sets a flat dollar ceiling, it does not: the cap is fixed in nominal terms and inflation erodes it every year until the legislature moves it. So the value side of this argument is stronger in percentage-cap states than in flat-cap states, and any firm relying on it should read its own statute rather than ours.
Where does this change the market we choose to advertise in?
Contraction is a national average and no firm advertises nationally. The decline is not uniform, because it is largely a composition story — the mix of work is shifting away from the industries that generate the most lost-time claims per worker. That means the injury-generating industry mix of a county is a better input to a market decision than its population, and it is public data. It also means the propensity to retain anyone varies by state far more than creative ever will. We would sequence a market decision on those two facts before looking at competitive density, which is the input most firms start with.
Sources & further reading
-
01
Injury frequency & the BLS series
The U.S. Bureau of Labor Statistics tracks employer-reported workplace injury and illness counts — the source for the long-run frequency decline and the 2024 series low.
-
02
Claim severity & the State of the Line
NCCI’s annual State of the Line report documents the rise in claim severity as frequency falls — the value side of the scissor.
-
03
Legal advertising volume & cost
The American Tort Reform Association tracks legal-services advertising by market, including the spend that keeps rising as claim volume falls.
-
04
Representation among lost-time claimants
About 34% of lost-time claimants are represented across a large multi-state dataset (WCRI) — the represented pool that stays stable as frequency falls.
-
05
Further reading
Related playbooks on competing in a contracting, higher-value category.
Figures are drawn from the sources above and change over time; confirm current data at the source. This article is general marketing information, not legal advice.